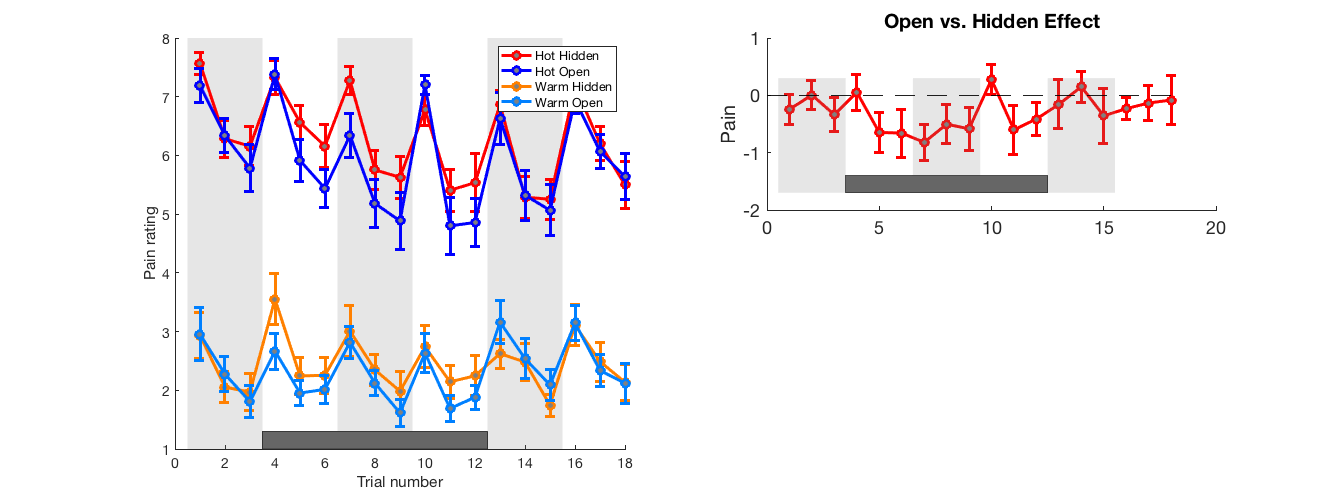
Atlas 2012 behavioral data plot
This example shows how to plot line plots for multiple conditions with error bars and calculate and plot violin plots for contrasts, with missing data.
Contents
Dependencies:
% Matlab statistics toolbox
  % Matlab signal processing toolbox
  % Statistical Parametric Mapping (SPM) software https://www.fil.ion.ucl.ac.uk/spm/
  % For full functionality, the full suite of CANlab toolboxes is recommended. See here: Installing Tools
General instructions
Before you start, the CANlab_Core_Tools must be added to your path with subfolders. Otherwise, you will get errors.
Sample datasets are in the "Sample_datasets" folder in CANlab_Core_Tools.
This example will use emotion regulation data in the file: "Atlas_2012_REMI_behavioral_data.mat" The dataset is a series of pain ratings from N = 19 participants before, during, and after open or hidden remifentanil delivery.
These data were published in: Atlas, L. Y., Whittington, R., Lindquist, M., Wielgosz, J., Sonty, N., Wager, T. D. (2012) Dissociable influences of opiates and expectations on pain. Journal of Neuroscience. 32(23): p. 8053-8064.
Here are a couple of helpful functions we will use for display: (you can ignore these.)
dashes = '----------------------------------------------';
printhdr = @(str) fprintf('%s\n%s\n%s\n', dashes, str, dashes);
Section 1: Load the data
The function load_image_set has a number of pre-defined image sets that you can load with one simple command. This is the easiest way to load sample data. The images must be on your Matlab path for this to work.
filename = which('Atlas_2012_REMI_behavioral_data.mat');
if isempty(filename), error('Data file is not on path!'); end

c = load(filename);

% c is an ad hoc data structure. The relevant fields are:
% c =
%
%            HO: [18x19 double]  TRIALS X SUBJECTS HOT OPEN PAIN SCORES
%            WO: [18x19 double]   TRIALS X SUBJECTS WARM OPEN PAIN SCORES
%            HH: [18x19 double] TRIALS X SUBJECTS HOT HIDDEN PAIN SCORES
%            WH: [18x19 double] TRIALS X SUBJECTS WARM HIDDEN PAIN SCORES

% It would be a very good idea to put these data in a canlab_dataset
% object, and then use the methods associated with that object to plot.
Section 2: Make a line plot of data by condition and time (trial)
printhdr('Line Plot by Condition');

% Set up the figure. create_figure is a function in the canlab toolbox that
% sets figure defaults and handles in a convenient way.

create_figure('remi pain', 1, 2);

% Draw some boxes to shade the background and mark off every other run

h1 = drawbox(.5, 3, 1, 7, [.5 .5 .5]); set(h1, 'FaceAlpha', .2, 'EdgeColor', 'none');
h1 = drawbox(6.5, 3, 1, 7, [.5 .5 .5]); set(h1, 'FaceAlpha', .2, 'EdgeColor', 'none');
h1 = drawbox(12.5, 3, 1, 7, [.5 .5 .5]); set(h1, 'FaceAlpha', .2, 'EdgeColor', 'none');

% Draw the box showing the drug delivery (and instruction) time

h1 = drawbox(3.5, 9, 1, .3, [.4 .4 .4]); set(h1, 'FaceAlpha', 1, 'EdgeColor', [.2 .2 .2]);

% Plot one line for each condition

h = lineplot_columns(c.HH', 'color', 'r');
h2 = lineplot_columns(c.HO', 'color', 'b');

h3 = lineplot_columns(c.WH', 'color', [1 .5 0]);
h4 = lineplot_columns(c.WO', 'color', [0 .5 1]);

% Set legend, labels

xlabel('Trial number');
ylabel('Pain rating');
set(gca, 'YLim', [1 8]);

legend([h.line_han h2.line_han h3.line_han h4.line_han], {'Hot Hidden' 'Hot Open' 'Warm Hidden' 'Warm Open'});

subplot(2, 2, 2)
% Now plot the trial-by-trial open vs. hidden differences

hot_openvs_hidden = (c.HO - c.HH)';

h = lineplot_columns(hot_openvs_hidden, 'color', 'r');

h1 = drawbox(.5, 3, -1.7, 2, [.5 .5 .5]); set(h1, 'FaceAlpha', .2, 'EdgeColor', 'none');
h1 = drawbox(6.5, 3, -1.7, 2, [.5 .5 .5]); set(h1, 'FaceAlpha', .2, 'EdgeColor', 'none');
h1 = drawbox(12.5, 3, -1.7, 2, [.5 .5 .5]); set(h1, 'FaceAlpha', .2, 'EdgeColor', 'none');

h1 = drawbox(3.5, 9, -1.7, .3, [.4 .4 .4]); set(h1, 'FaceAlpha', 1, 'EdgeColor', [.2 .2 .2]);
h1 = plot_horizontal_line(0);
set(h1, 'LineStyle', '--');

set(gca, 'FontSize', 18);
title('Open vs. Hidden Effect');
ylabel('Pain');

drawnow, snapnow
----------------------------------------------
Line Plot by Condition
----------------------------------------------

Section 3: Make bar/violin plots of the contrasts
printhdr('Violin Plots of Contrasts');

% Identify trials when instructions/drug are being delivered.

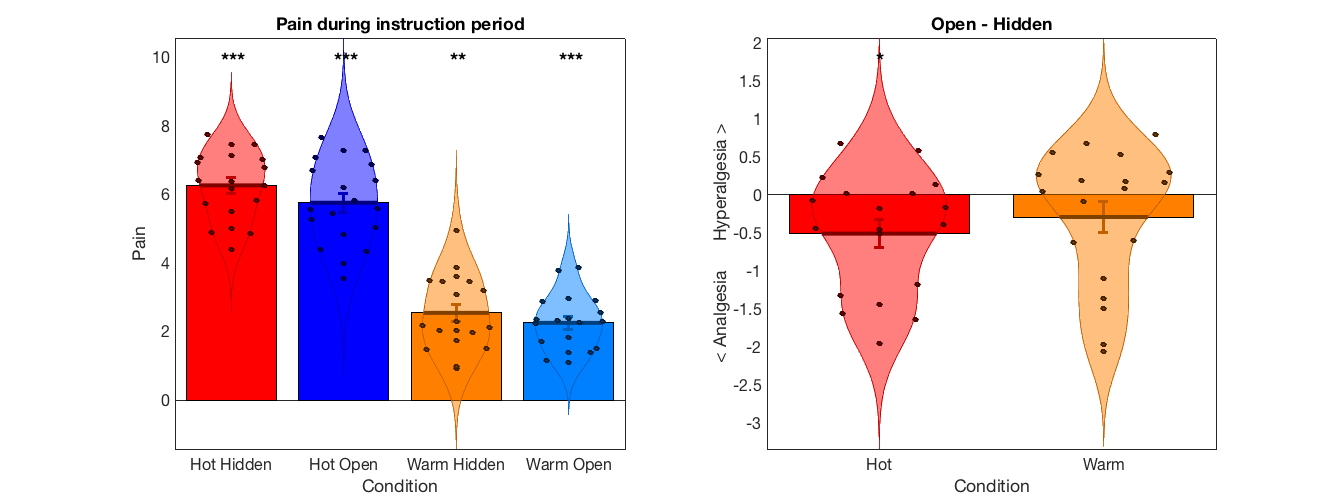
instruction_contrast = [-1 -1 -1 1 1 1 1 1 1 1 1 1 -1 -1 -1 -1 -1 -1]';

% Get means for this period for each subject x condition.
% Avoid NaNs by omitting case/subject-wise.

hot_hidden_during_instruct = nanmean(c.HH(instruction_contrast > 0, :))';
hot_open_during_instruct = nanmean(c.HO(instruction_contrast > 0, :))';
warm_hidden_during_instruct = nanmean(c.WH(instruction_contrast > 0, :))';
warm_open_during_instruct = nanmean(c.WO(instruction_contrast > 0, :))';

X = [hot_hidden_during_instruct hot_open_during_instruct warm_hidden_during_instruct warm_open_during_instruct ];
names = {'Hot Hidden' 'Hot Open' 'Warm Hidden' 'Warm Open'};

% Create the figure

create_figure('bars', 1, 2);
barplot_columns(X, 'nofig', 'colors', {[1 0 0] [0 0 1] [1 .5 0] [0 .5 1]})
set(gca, 'XTickLabel', names);
set(gca, 'FontSize', 16);
ylabel('Pain');

title('Pain during instruction period');

subplot(1, 2, 2);
contrasts = [-1 1 0 0; 0 0 -1 1]';
convalues = X * contrasts;
connames = {'Hot' 'Warm'};

barplot_columns(convalues, 'nofig', 'colors', {[1 0 0] [1 .5 0]})
set(gca, 'FontSize', 16);
set(gca, 'XTickLabel', connames);
title('Open - Hidden');
ylabel('< Analgesia      Hyperalgesia >');
----------------------------------------------
Violin Plots of Contrasts
----------------------------------------------
Column   1:	Column   2:	Column   3:	Column   4:
---------------------------------------------
Tests of column means against zero
---------------------------------------------
      Name       Mean_Value    Std_Error      T           P         Cohens_d
    _________    __________    _________    ______    __________    ________

    'Col   1'      6.2625       0.22782      27.49    2.2204e-15     6.3065
    'Col   2'      5.7536       0.27784     20.708     5.277e-14     4.7508
    'Col   3'      2.5417       0.24867     10.221    6.3738e-09     2.3448
    'Col   4'      2.2509       0.18292     12.306    3.3631e-10     2.8231


ans =

  struct with fields:

         fig_han: [1×1 struct]
        axis_han: [1×1 Axes]
        bar_han1: [1×1 Bar]
         bar_han: {[1×1 Bar]  [1×1 Bar]  [1×1 Bar]  [1×1 Bar]}
    errorbar_han: {1×4 cell}
      point_han1: {19×4 cell}
       point_han: {19×4 cell}
    star_handles: [3.0249 4.0249 5.0249 6.0249]

Column   1:	Column   2:
---------------------------------------------
Tests of column means against zero
---------------------------------------------
      Name       Mean_Value    Std_Error       T          P        Cohens_d
    _________    __________    _________    _______    ________    ________

    'Col   1'     -0.50892      0.17928     -2.8386    0.010896    -0.65122
    'Col   2'     -0.29077      0.20599     -1.4116     0.17512    -0.32384


ans =

  struct with fields:

         fig_han: [1×1 struct]
        axis_han: [1×1 Axes]
        bar_han1: [1×1 Bar]
         bar_han: {[1×1 Bar]  [1×1 Bar]}
    errorbar_han: {[1×1 ErrorBar]  [1×1 ErrorBar]}
      point_han1: {19×2 cell}
       point_han: {19×2 cell}
    star_handles: [7.0249 8.0249]

Section 4: Print table of means to save for later
printhdr('Subject means by condition');

print_matrix(X, names);
----------------------------------------------
Subject means by condition
----------------------------------------------
Hot Hidden	Hot Open	Warm Hidden	Warm Open
7.7434	7.6649	3.4980	3.7670
7.0654	7.2886	0.9093	1.1000
7.1419	6.6953	0.9672	1.1408
4.8907	5.5646	2.3020	2.8651
5.7341	5.2731	3.0744	1.7093
6.3956	6.4080	2.1806	2.2199
6.3687	5.0437	3.4581	2.3563
5.0163	4.8375	3.5910	2.9589
7.0158	5.4512	3.4540	1.4902
5.8302	4.3915	3.8674	2.3687
6.1806	6.1972	1.4840	1.3972
7.4499	7.2845	3.1915	3.8728
6.9351	7.0778	2.0297	2.3212
7.4499	5.8147	4.9444	2.8907
4.3837	3.9956	1.7424	1.8271
4.8535	4.3408	2.0152	2.5465
5.4943	3.5429	1.9739	1.3744
6.2695	6.8587	2.1083	2.2654
6.7698	5.5884	1.5000	2.2953