Datasets used in CANlab tutorials
Note: this report was generated from canlab_help_2c_loading_datasets.m in the repository https://github.com/canlab/CANlab_help_examples
Contents
- The Neuroimaging_pattern_masks Github repository and website
- Registries for easy loading
- Emotion regulation dataset
- Buckner lab resting-state connectivity maps
- Pain, Cognition, Emotion balanced N = 270 dataset
- Pain across six intensity levels per person (BMRK3)
- CANlab 2018 Combined Atlas object
- Kragel 2015 emotion category-predictive patterns
- Subcortical and brainstem regions
The Neuroimaging_pattern_masks Github repository and website
For these walkthroughs, we'll load several image datasets. Some are stored in Github, if the files are small enough. The Wager 2008 emotion regulation dataset, for example, is in the CANlab Core repository. Others are on figshare or Neurovault.
Many tutorials apply pre-trained patterns and masks. These are stored in this Github repository:
https://github.com/canlab/Neuroimaging_Pattern_Masks
In addition, you can explore these and find more information here: https://sites.google.com/dartmouth.edu/canlab-brainpatterns/home
To run this tutorial and many others in this series, you'll need to download the Neuroimaging_Pattern_Masks Github repository and add it to your Matlab path with subfolders. The Github site has three main types of datasets, shown here:

Registries for easy loading
There are several functions that contain sets of images that you can load by name. For example:
load_image_set() includes a registry of datasets that you can access by name. Try help load_image|set for a list of images you can load by keyword.
load_atlas() also has a named set of atlases/brain parcellations you can load.
canlab_load_ROI has a registry of many named regions derived from previous studies. This is particularly useful for loading a subcortical ROI and visualizing it or applying it to data.
Emotion regulation dataset
"Wager_et_al_2008_Neuron_EmotionReg" The dataset is a series of contrast images from N = 30 participants. Each image is a contrast image for [reappraise neg vs. look neg]
These data were published in: Wager, T. D., Davidson, M. L., Hughes, B. L., Lindquist, M. A., Ochsner, K. N.. (2008). Prefrontal-subcortical pathways mediating successful emotion regulation. Neuron, 59, 1037-50.
To load, try the following:
[data_obj, subject_names, image_names] = load_image_set('emotionreg', 'noverbose');

montage(mean(data_obj), 'trans', 'compact2');
drawnow, snapnow

% data_obj is an fmri_data object containing all 30 images.
% subject_names is a list of short names for each image.
% image_names is a list of the full image names with their path.
Direct calls to spm_defauts are deprecated.
Please use spm('Defaults',modality) or spm_get_defaults instead.
Setting up fmridisplay objects
axial montage: 16574 voxels displayed, 19102 not displayed on these slices
sagittal montage: 2230 voxels displayed, 33446 not displayed on these slices
Buckner lab resting-state connectivity maps
A popular series of masks is a set of "networks" developed from resting-state fMRI connectivity in 1,000 people. For our purposes, the "network" maps consist of a set of voxels that load most highly on each of 7 ICA components from the 1,000 Functional Connectomes project. These were published by Randy Buckner's lab in 2011 in three papers: Choi et al., Buckner et al., and Yeo et al. We'll use the cortical networks from Yeo et al. here.
[bucknermaps, mapnames] = load_image_set('bucknerlab', 'noverbose'); % loads 7 masks from Yeo et al.
disp(char(mapnames))

% Create a montage plot
o2 = montage(get_wh_image(bucknermaps, 1), 'trans', 'compact2', 'color', rand(1, 3));
for i = 2:7, o2 = addblobs(o2, region(get_wh_image(bucknermaps, i)), 'trans', 'color', rand(1, 3)); end
drawnow, snapnow
Visual
Somatomotor
dAttention
vAttention
Limbic
Frontoparietal
Default
Setting up fmridisplay objects
axial montage: 5637 voxels displayed, 16451 not displayed on these slices
sagittal montage: 658 voxels displayed, 21430 not displayed on these slices
No variability in mapped values. Not plotting legend.
Grouping contiguous voxels:   1 regions
axial montage: 2819 voxels displayed, 16654 not displayed on these slices
sagittal montage: 498 voxels displayed, 18975 not displayed on these slices
Grouping contiguous voxels:   7 regions
axial montage: 2403 voxels displayed, 12844 not displayed on these slices
sagittal montage: 132 voxels displayed, 15115 not displayed on these slices
Grouping contiguous voxels:  11 regions
axial montage: 3137 voxels displayed, 10511 not displayed on these slices
sagittal montage: 521 voxels displayed, 13127 not displayed on these slices
Grouping contiguous voxels:   1 regions
axial montage: 2174 voxels displayed, 9345 not displayed on these slices
sagittal montage: 338 voxels displayed, 11181 not displayed on these slices
Grouping contiguous voxels:  16 regions
axial montage: 4378 voxels displayed, 15124 not displayed on these slices
sagittal montage: 487 voxels displayed, 19015 not displayed on these slices
Grouping contiguous voxels:  10 regions
axial montage: 7133 voxels displayed, 22886 not displayed on these slices
sagittal montage: 1583 voxels displayed, 28436 not displayed on these slices
Pain, Cognition, Emotion balanced N = 270 dataset
This Dataset is from Kragel et al. 2018, Nature Neuroscience. We thought it was too large for Github, and it's stored on Neurovault.org as collection #504. You could get it using:
[files_on_disk, url_on_neurovault, mycollection, myimages] = retrieve_neurovault_collection(504);
However, this may take a while to download, and you'd have to add metadata for the study category labels to use it. Therefore, we suggest you use the function below. It saves a file on your hard drive the first time you run it:
kragel_2018_nat_neurosci_270_subjects_test_images.mat
This file also has metadata that is not necessarily on Neurovault. If you save this file somewhere on your Matlab path, you'll be able to reload and reuse the dataset easily.
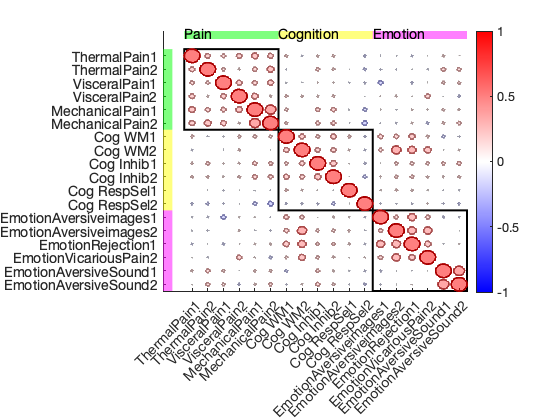
[test_images, names] = load_image_set('kragel18_alldata', 'noverbose');

% This field contains a table object with metadata for each image:
metadata = test_images.metadata_table;

disp('Metadata available in test_images.metadata_table:')
metadata(1:5, :)

% Make a plot of the spatial correlation of the average image for each study

imgs = cellstr(test_images.image_names);
m = mean(test_images);

for i = 1:length(names)

    % Create a mean image for each study and store in "m" object.

    wh = metadata.Studynumber == i;
    studymean = mean(get_wh_image(test_images, find(wh)));
    m.dat(:, i) = studymean.dat;

end

disp('Map of spatial correlations across the mean images for each study');

plot_correlation_matrix(m.dat, 'names', names, 'partitions', [ones(1, 6) 2*ones(1, 6) 3*ones(1, 6)], 'partitionlabels', {'Pain', 'Cognition', 'Emotion'});
drawnow, snapnow
Loading /Users/torwager/Dropbox (Dartmouth College)/COURSES/Courses_Dartmouth/2021_3_Spring_fMRI_Class/PSYC60_Shared_resources_for_students/datasets/kragel_2018_nat_neurosci_270_subjects_test_images.mat
Metadata available in test_images.metadata_table:

ans =

  5×6 table

     Domain      Subdomain        imagenames       Studynumber    Orig_Studynumber        StudyCodes
    ________    ___________    ________________    ___________    ________________    __________________

    {'Pain'}    {'Thermal'}    {'ThermalPain1'}         1                10           {'Atlas_2010_EXP'}
    {'Pain'}    {'Thermal'}    {'ThermalPain1'}         1                10           {'Atlas_2010_EXP'}
    {'Pain'}    {'Thermal'}    {'ThermalPain1'}         1                10           {'Atlas_2010_EXP'}
    {'Pain'}    {'Thermal'}    {'ThermalPain1'}         1                10           {'Atlas_2010_EXP'}
    {'Pain'}    {'Thermal'}    {'ThermalPain1'}         1                10           {'Atlas_2010_EXP'}

Map of spatial correlations across the mean images for each study
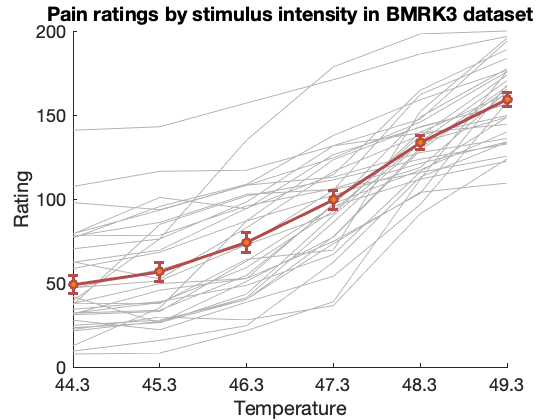
Pain across six intensity levels per person (BMRK3)
The dataset contains data from 33 participants, with brain responses to six levels of heat (non-painful and painful). Each image is the average over several (4-8) trials of heat delivered at a single stimulus intensity, ranging from 44.3 - 49.3 degrees C in one-degree increments. Each image is also paired with an average reported pain value for that set of trials, rated immmediately after heat experience.
This dataset is interesting for mixed-effects and predictive analyses, as it has both within-person and between-person sources of variance.
Aspects of this data appear in these papers: Wager, T.D., Atlas, L.T., Lindquist, M.A., Roy, M., Choong-Wan, W., Kross, E. (2013). An fMRI-Based Neurologic Signature of Physical Pain. The New England Journal of Medicine. 368:1388-1397 (Study 2)
Woo, C. -W., Roy, M., Buhle, J. T. & Wager, T. D. (2015). Distinct brain systems mediate the effects of nociceptive input and self-regulation on pain. PLOS Biology. 13(1): e1002036. doi:10.1371/journal.pbio.1002036
Lindquist, Martin A., Anjali Krishnan, Marina López-Solà, Marieke Jepma, Choong-Wan Woo, Leonie Koban, Mathieu Roy, et al. 2015. ?Group-Regularized Individual Prediction: Theory and Application to Pain.? NeuroImage. http://www.sciencedirect.com/science/article/pii/S1053811915009982.
This dataset is shared on figshare.com, under this link: https://figshare.com/s/ca23e5974a310c44ca93
Here is a direct link to the dataset file with the fmri_data object: https://ndownloader.figshare.com/files/12708989
The key variable is image_obj, an fmri_data class object. See https://canlab.github.io/
image_obj.dat contains brain data for each image (average across trials) image_obj.Y contains pain ratings (one average rating per image)
image_obj.additional_info.subject_id contains integers coding for which Load the data file, downloading from figshare if needed
fmri_data_file = which('bmrk3_6levels_pain_dataset.mat');

if isempty(fmri_data_file)

    % attempt to download
    disp('Did not find data locally...downloading data file from figshare.com')

    fmri_data_file = websave('bmrk3_6levels_pain_dataset.mat', 'https://ndownloader.figshare.com/files/12708989');

end

load(fmri_data_file);

descriptives(image_obj);

subject_id = image_obj.additional_info.subject_id;
ratings = reshape(image_obj.Y, 6, 33)';
temperatures = image_obj.additional_info.temperatures;

% Plot the ratings

create_figure('ratings');
title('Pain ratings by stimulus intensity in BMRK3 dataset')
hold on; plot(ratings', '-', 'Color', [.7 .7 .7], 'LineWidth', .5);
lineplot_columns(ratings, 'color', [.7 .3 .3], 'markerfacecolor', [1 .5 0]);
xlabel('Temperature');
ylabel('Rating');
set(gca, 'XTickLabel', [44.3:49.3], 'FontSize', 18);
drawnow, snapnow
Source: BMRK3 dataset from CANlab, PI Tor Wager
Data: .dat contains 6 images per participant, activation estimates during heat on L arm from level 1(44.3 degrees C) to level 6(49.3), in 1 degree increments.


____________________________________________________________________________________________________________________________________________
 Wager, T.D., Atlas, L.T., Lindquist, M.A., Roy, M., Choong-Wan, W., Kross, E. (2013). An fMRI-Based Neurologic Signature of Physical Pain.
The New England Journal of Medicine. 368:1388-1397 (Study 2)

 Woo, C. -W., Roy, M., Buhle, J. T. & Wager, T. D. (2015). Distinct brain systems mediate the effects of nociceptive input and
self-regulation on pain. PLOS Biology. 13(1): e1002036. doi:10.1371/journal.pbio.1002036

Lindquist, Martin A., Anjali Krishnan, Marina López-Solà, Marieke Jepma, Choong-Wan Woo, Leonie Koban, Mathieu Roy, et al. 2015.
“Group-Regularized Individual Prediction: Theory and Application to Pain.” NeuroImage.
http://www.sciencedirect.com/science/article/pii/S1053811915009982.

____________________________________________________________________________________________________________________________________________

Summary of dataset
______________________________________________________
Images: 198	Nonempty: 198	Complete: 198
Voxels: 223707	Nonempty: 223707	Complete: 223707
Unique data values: 35583281

Min: -11.529	Max: 7.862	Mean: -0.004	Std: 0.227

    Percentiles      Values
    ___________    __________

        0.1            -1.529
        0.5          -0.88055
          1          -0.67632
          5          -0.31891
         25         -0.087519
         50        0.00034864
         75          0.087461
         95           0.29757
         99           0.60449
       99.5           0.77676
       99.9            1.3177
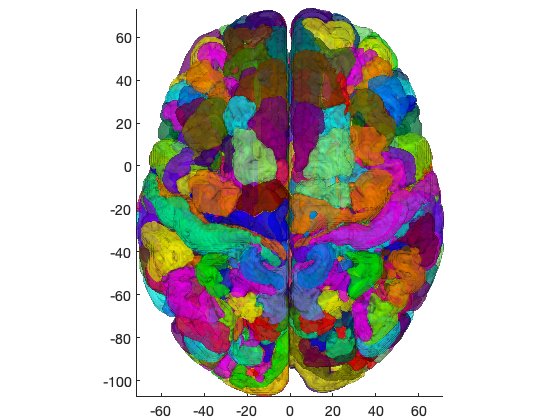
CANlab 2018 Combined Atlas object
An atlas-class object is a specialized subclass of fmri_data that stores information about a series of parcels, or pre-defined regions, and in some cases the probalistic maps that underlie the final parcellation.
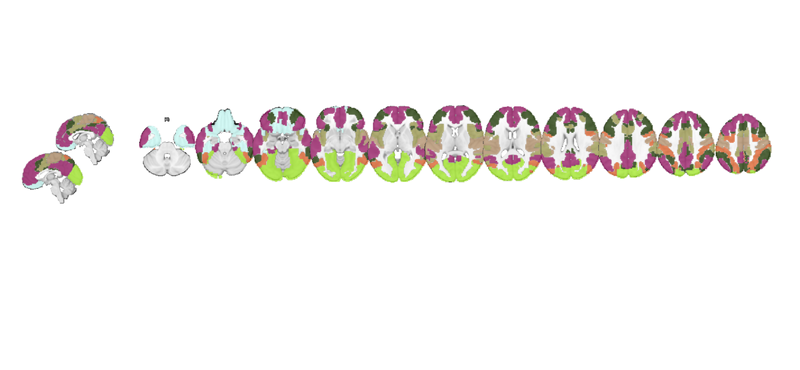
A list of pre-defined atlases is contained in the function load_atlas. The default atlas for some CANlab functions is the "CANlab combined 2018" This was created by Tor Wager from other published atlases. It includes:
- Glasser 2016 Nature 180-region cortical parcellation (in MNI space, not indivdidualized)
- Pauli 2016 PNAS basal ganglia subregions
- Amygdala/hippocampal and basal forebrain regions from SPM Anatomy Toolbox
- Thalamus regions from the Morel thalamus atlas
- Subthalamus/Basal forebrain regions from Pauli "reinforcement learning" HCP atlas
- Diedrichsen cerebellar atlas regions
- Multiple named brainstem nuclei localized based on individual papers
- Additional Shen atlas parcels to cover areas (esp. brainstem) not otherwise named
References for the corresponding papers are stored in the atlas object, and printed in tables generated with the region.table() method.
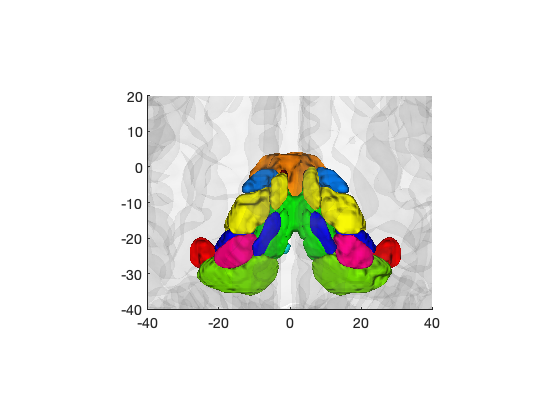
atlas_obj = load_atlas('canlab2018');

% Create a figure showing cortical parcels
create_figure('iso'); isosurface(atlas_obj, 'alpha', .5);
drawnow, snapnow

% Create a figure of the thalamus regions only
thal = select_atlas_subset(atlas_obj, {'Thal'});
create_figure('iso'); isosurface(thal);
hh = addbrain('hires');
set(hh, 'FaceAlpha', 0.05);
set(gca, 'XLim', [-40 40], 'YLim', [-40 20]);
drawnow, snapnow
Loading atlas: CANlab_combined_atlas_object_2018.mat
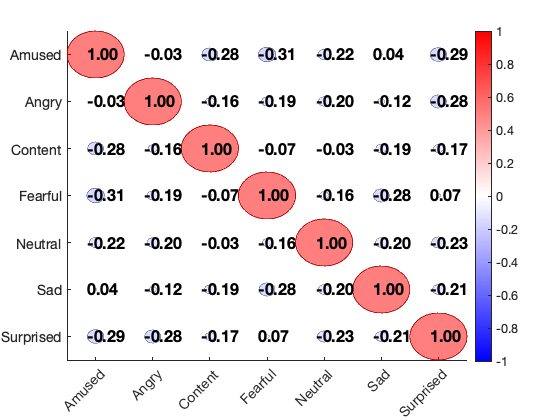
Kragel 2015 emotion category-predictive patterns
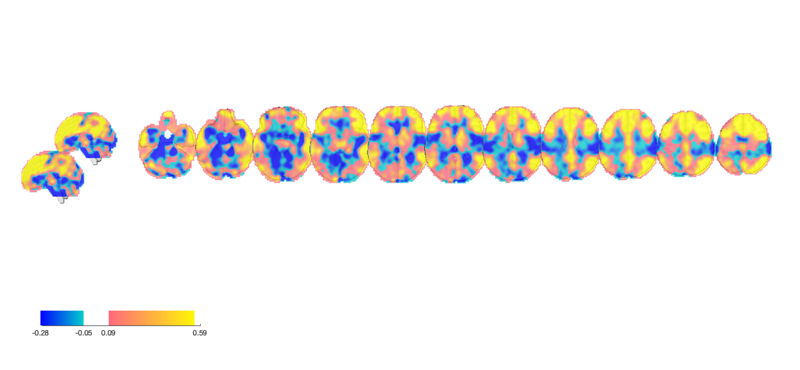
This loads a series of 7 multivariate patterns from Kragel et al. 2015. These patterns were developed to predict emotion categories. For our purposes here, we'll just treat them as data images.
[test_dat, names] = load_image_set('kragelemotion', 'noverbose'); % loads 7 masks from Kragel et al.
disp(char(names))

% Plot spatial correlations
plot_correlation_matrix(test_dat.dat, 'names', names);
drawnow, snapnow
Amused
Angry
Content
Fearful
Neutral
Sad
Surprised
Subcortical and brainstem regions
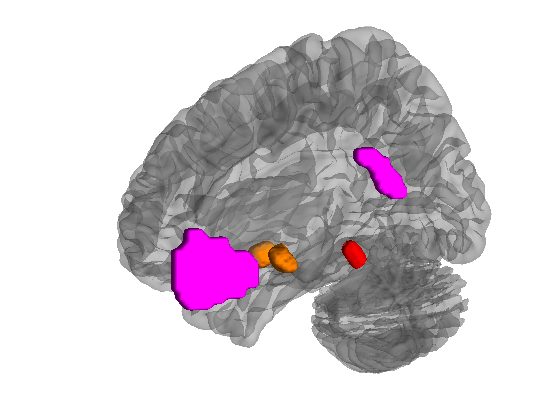
canlab_load_ROI has a registry of many named regions derived from previous studies. This is particularly useful for loading a subcortical ROI and visualizing it or applying it to data.
help canlab_load_ROI

vmpfc = canlab_load_ROI('vmpfc');
nac =  canlab_load_ROI('nac');
pag =  canlab_load_ROI('pag');

create_figure('brain');
isosurface(vmpfc, 'color', {[1 0 1]});
isosurface(nac, 'color', {[1 .5 0]});
isosurface(pag, 'color', {[1 0 0]});
bhan = addbrain('hires right');
view(-119, 5);
drawnow, snapnow
  Load a region by name (hand-picked from various atlases), for display or use as ROI in analysis

  - r is a region object, useful for display (e.g., addbrain.m and any region object method)
  - atlas_obj is an atlas object containing regions, mapped to a standard reference space (1 mm res)
    this can be slow for some objects and is not needed for region display
    (e.g., addblobs.m), so 'noatlas' will return an empty atlas_obj instead

  - Easy to add regions from region objects or binary masks (.nii/.img)
  - Some regions best for display only; some good as ROIs as well
  - Inter-operates with addbrain.m to load regions for display


  :Usage:
  ::

     [r, atlas_obj, default_color, region_file, image_file] = canlab_load_ROI(region_name,[optional arguments])

  Working options:
  -----------------------------------------------------------
  {'vmpfc' 'nacc' 'BST' ...
      'cau' 'caudate' 'put' 'GP' 'GPe' 'GPi' 'VeP' ...
      'thalamus' 'thal' 'cm' 'md' 'stn' 'habenula' 'mammillary' 'hypothalamus','hy','hythal' ...
      'brainstem' 'midbrain' 'pag' 'PBP' 'sn' 'SNc' 'SNr' 'VTA' 'rn' ...
      'pbn' 'lc' 'rvm' 'rvm_old' 'nts' 'drn' 'mrn' 'sc' 'ic'}

  Cortex -----------------------------------------------------------
  'vmpfc'   Ventromedial prefrontal + posterior cing, midline; hand-drawn (Tor Wager)

  Forebrain (non-basal ganglia)
  -----------------------------------------------------------
  'nacc'    Nucleus accumbens               % Pauli 2017 BioArxiv subcortical atlas
  'hipp'    Hippocampus                     % MISSING/NEEDS UPDATE
  'BST'     Bed nuc. of stria term/SLEA     % Pauli 2017 BioArxiv subcortical atlas

  Basal ganglia
  -----------------------------------------------------------
  'caudate'  Caudate nucleus
  'put'      Putamen            % MISSING
  'GP'       Globus pallidus; Keuken 2014
  'GPe'       Globus pallidus internal; Keuken 2014
  'GPi'       Globus pallidus external; Keuken 2014
  'VeP'        Ventral pallidum           % Pauli 2017 BioArxiv subcortical atlas

   Thalamus, Diencephalon, Epithalamus
  -----------------------------------------------------------
  'thalamus'                        Morel thalamus main body, Krauth 2010
  'cm'      Centromedian thalamus   Morel thalamus atlas, Krauth 2010
  'md'      Mediodorsal thalamus    Morel thalamus atlas, Krauth 2010
  'stn'     subthalamic nucleus     Keuken 2014 (also options in Pauli, Morel)
  'habenula'     Habenula           Pauli 2017 BioArxiv subcortical atlas (also in Morel)
  'mammillary'   Mammillary bodies  Pauli 2017 BioArxiv subcortical atlas
  'lgn'     Lateral geniculate nuc  Morel thalamus atlas, Krauth 2010
  'mgn'     Medial geniculate nuc   Morel thalamus atlas, Krauth 2010
  'VPthal'  Ventral posterior thal  Morel thalamus atlas, Krauth 2010
  'intralaminar_thal' Intralaminar  Morel thalamus atlas, Krauth 2010

  Brainstem
  -----------------------------------------------------------
  'brainstem'  Segmented and cleaned (Tor Wager) from SPM8 tissue probability maps
  'midbrain'   Overall midbrain, from Carmack 2004
  'pag'        Periaqueductal gray, hand-drawn (Tor Wager 2018, mask out aqueduct/Keuken2014)
  'sc'         Superior colliculus, hand-drawn (Tor Wager 2018, mask out aqueduct/Keuken2014)
  'ic'         Inferior colliculus, hand-drawn (Tor Wager 2018, mask out aqueduct/Keuken2014)
  'drn'        Dorsal raphe nucleus, coords from Beliveau, 2015. Beliveau, Vincent, Claus Svarer, Vibe G. Frokjaer, Gitte M. Knudsen, Douglas N. Greve, and Patrick M. Fisher. 2015. ?Functional Connectivity of the Dorsal and Median Raphe Nuclei at Rest.? NeuroImage 116 (August): 187?95.
  'mrn'        Median raphe nucleus, coords from Beliveau, 2015. Beliveau, Vincent, Claus Svarer, Vibe G. Frokjaer, Gitte M. Knudsen, Douglas N. Greve, and Patrick M. Fisher. 2015. ?Functional Connectivity of the Dorsal and Median Raphe Nuclei at Rest.? NeuroImage 116 (August): 187?95.
  'PBP'        Parabrachial pigmented nuc.      % Pauli 2017 BioArxiv subcortical atlas
  'sn'         Substantia Nigra; Keuken 2014   % Keuken, M. C., P-L Bazin, L. Crown, J. Hootsmans, A. Laufer, C. Müller-Axt, R. Sier, et al. 2014. ?Quantifying Inter-Individual Anatomical Variability in the Subcortex Using 7 T Structural MRI.? NeuroImage 94 (July): 40?46.
  'SNc'        Substantia Nigra compacta        % Pauli 2017 BioArxiv subcortical atlas
  'SNr'        Substantia Nigra reticularis     % Pauli 2017 BioArxiv subcortical atlas
  'VTA'        Ventral tegmental area           % Pauli 2017 BioArxiv subcortical atlas
  'rn'         Red nucleus; Keuken 2014
  'pbn'        Parabrachial complex; Fairhurst, Merle, Katja Wiech, Paul Dunckley, and Irene Tracey. 2007. ?Anticipatory Brainstem Activity Predicts Neural Processing of Pain in Humans.? Pain 128 (1-2):101?10.
  'lc'         Locus coeruleus; Keren 2009, 2SD image
  'rvm_old'    Hand-drawn rostral ventral medulla (Tor) in anatomical rvm
  'rvm'        Rostral ventral medulla from Brooks et al. 2016(??)
  'nts'        Nuc. tractus solitarius (rough; hand-drawn, Tor)
  'olive'      Inferior olive; MISSING
  'nrm'        Nuc. raphe magnus; % Bär, Karl-Jürgen, Feliberto de la Cruz, Andy Schumann, Stefanie Koehler, Heinrich Sauer, Hugo Critchley, and Gerd Wagner. 2016. ?Functional Connectivity and Network Analysis of Midbrain and Brainstem Nuclei.? NeuroImage 134 (July):53?63.
  'ncf'        Nuc. cuneiformis; Zambreanu, L., R. G. Wise, J. C. W. Brooks, G. D. Iannetti, and I. Tracey. 2005. ?A Role for the Brainstem in Central Sensitisation in Humans. Evidence from Functional Magnetic Resonance Imaging.? Pain 114 (3):397?407.
  'ncs_B6_B8'  Bär, Karl-Jürgen, Feliberto de la Cruz, Andy Schumann, Stefanie Koehler, Heinrich Sauer, Hugo Critchley, and Gerd Wagner. 2016. ?Functional Connectivity and Network Analysis of Midbrain and Brainstem Nuclei.? NeuroImage 134 (July):53?63.
  'nrp_B5'     Bär, Karl-Jürgen, Feliberto de la Cruz, Andy Schumann, Stefanie Koehler, Heinrich Sauer, Hugo Critchley, and Gerd Wagner. 2016. ?Functional Connectivity and Network Analysis of Midbrain and Brainstem Nuclei.? NeuroImage 134 (July):53?63.
  'nuc_ambiguus' Sclocco, Roberta, Florian Beissner, Gaelle Desbordes, Jonathan R. Polimeni, Lawrence L. Wald, Norman W. Kettner, Jieun Kim, et al. 2016. ?Neuroimaging Brainstem Circuitry Supporting Cardiovagal Response to Pain: A Combined Heart Rate Variability/ultrahigh-Field (7 T) Functional Magnetic Resonance Imaging Study.? Philosophical Transactions. Series A, Mathematical, Physical, and Engineering Sciences 374 (2067). rsta.royalsocietypublishing.org. https://doi.org/10.1098/rsta.2015.0189.
  'dmnx_nts'    Sclocco, Roberta, Florian Beissner, Gaelle Desbordes, Jonathan R. Polimeni, Lawrence L. Wald, Norman W. Kettner, Jieun Kim, et al. 2016. ?Neuroimaging Brainstem Circuitry Supporting Cardiovagal Response to Pain: A Combined Heart Rate Variability/ultrahigh-Field (7 T) Functional Magnetic Resonance Imaging Study.? Philosophical Transactions. Series A, Mathematical, Physical, and Engineering Sciences 374 (2067). rsta.royalsocietypublishing.org. https://doi.org/10.1098/rsta.2015.0189.
  'vep'          % Pauli 2017 BioArxiv CIT168 subcortical atlas
  'medullary_raphe' Nash, Paul G., Vaughan G. Macefield, Iven J. Klineberg, Greg M. Murray, and Luke A. Henderson. 2009. ?Differential Activation of the Human Trigeminal Nuclear Complex by Noxious and Non-Noxious Orofacial Stimulation.? Human Brain Mapping 30 (11):3772?82.
  'spinal_trigeminal' Nash, Paul G., Vaughan G. Macefield, Iven J. Klineberg, Greg M. Murray, and Luke A. Henderson. 2009. ?Differential Activation of the Human Trigeminal Nuclear Complex by Noxious and Non-Noxious Orofacial Stimulation.? Human Brain Mapping 30 (11):3772?82.

  Examples:

  [r, obj, default_color, region_file, image_file] = canlab_load_ROI('vmpfc');
  orthviews(r, 'color', {default_color});

  [r, myatlas] = canlab_load_ROI('habenula'); num_regions(myatlas); orthviews(myatlas)
  r = canlab_load_ROI('habenula', 'noatlas'); orthviews(r)

Grouping contiguous voxels:   2 regions