Publishing reports
Contents
Why?
Publishing reports of your data analysis is a great way to save code and results.
If you're doing a paper, you can save a record of what you did in the report, and what the results were.
You can save figures in your report, and stats and tables too ... And even interpretation of your results
This is a great record, and if done right, will allow you to reproduce your analysis, and make changes if needed and re-run efficiently.
If you do it right, you can write your paper right from your report, and then archive the report (with more details and discussion) for later.
How?
Create a Matlab script that runs your analysis, and format it with Matlab markup.
The markup tells it how to create sections, headers, text, and code blocks. This file serves as a basic example.
Then, publish your code by: * Clicking on the Publish tab at the top of the Editor, then "Publish" arrow * Running publish('yourscriptname.m')
This creates a file with your report. Type help publish to get options for what type of report to create.
We'll use .html reports. An advantage is that you can scroll through them quickly to see results, click on sections, and view them in any web browser.
More tips
To submit/save a report, make a zip file of all the files in your html output directory, and save/submit the zip
To add figures produced within Matlab, just have the code generate those figures. To save the current figure windows to the report when you publish, add drawnow, snapnow to your code. Like this:
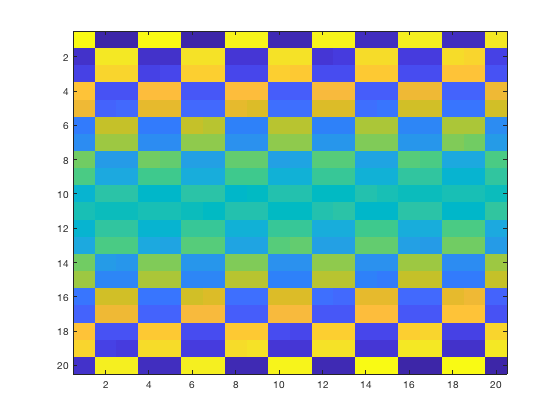
a = magic(20);
figure; imagesc(a);
drawnow, snapnow
To add an external figure, put a .png file of your figure in your HTML output directory, and refer to it using figname.png > in your script.
More help on markup is on the web. e.g., https://www.mathworks.com/help/matlab/matlab_prog/marking-up-matlab-comments-for-publishing.html
All the m-files (original code) for walkthroughs on canlab.github.io are in this repository: https://github.com/canlab/CANlab_help_examples
You can examine or modify any of those and re-publish them to HTML yourself.
Below is some code that sets a useful set of options for HTML and publishes this demo script.
Run this code to publish this file to HTML on your computer
pubdir = fullfile(fileparts(which('canlab_help_publish')), 'canlab_help_2d_publish_a_report'); % Set the output directory
pubfilename = 'canlab_help_2d_publish_a_report'; % The script you want to publish
p = struct('useNewFigure', false, 'maxHeight', 800, 'maxWidth', 800, ...
  'format', 'html', 'outputDir', pubdir, ...
  'showCode', true, 'stylesheet', which('mxdom2simplehtml_CANlab.xsl'));
htmlfile = publish(pubfilename, p);
% Open the published file in the web browser
web(htmlfile)
Explore on your own
1. Try modifying the text of this file in various ways and re-publishing it.
2. Try adding an external picture, a code block, and some other markup
3. Try producing a plot within Matlab.
4. Try opening one of the walkthroughs on https://github.com/canlab/CANlab_help_examples and re-oublish it to an HTML file on your computer.