Contents
Load a test map to use as an example
ns=load(which('neurosynth_data_obj.mat'));test_map=get_wh_image(ns.topic_obj_reverseinference,1);
Run annotations
annotate_binary_results_map(test_map)
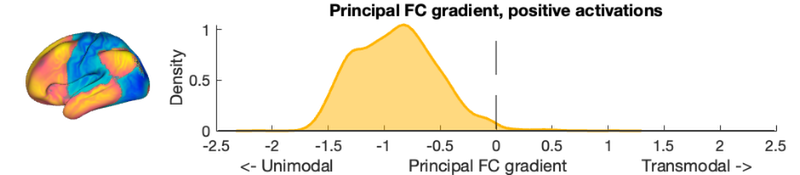
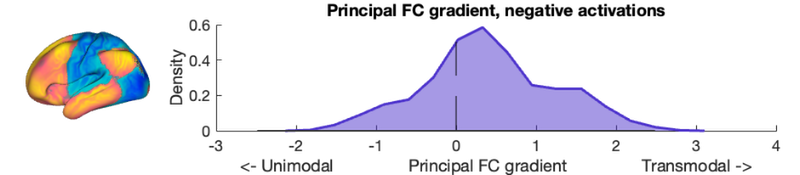
Transmodal vs. unimodal: Principal gradient of functional connectivity
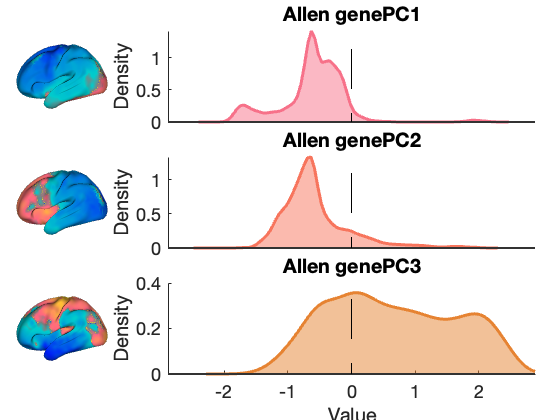
Allen brain project transcriptomic gradients
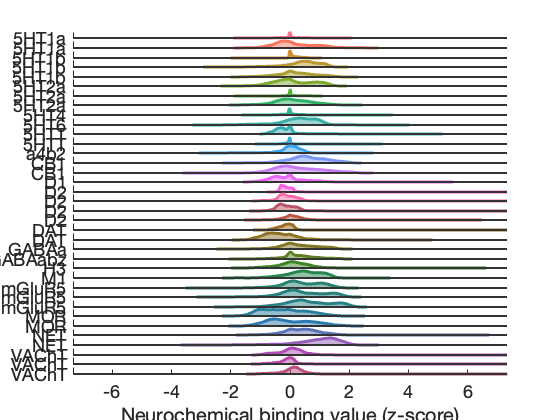
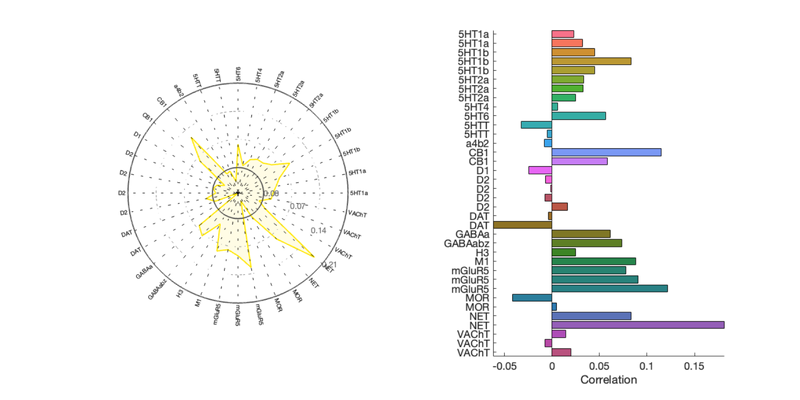
Neuromaps PET neurochemical tracer maps
Name Pearson's r
5HT1a 0.0229
5HT1a 0.0319
5HT1b 0.0451
5HT1b 0.0831
5HT1b 0.0451
5HT2a 0.0330
5HT2a 0.0326
5HT2a 0.0245
5HT4 0.0056
5HT6 0.0566
5HTT -0.0327
5HTT -0.0054
a4b2 -0.0081
CB1 0.1152
CB1 0.0581
D1 -0.0247
D2 -0.0069
D2 -0.0012
D2 -0.0077
D2 0.0165
DAT -0.0038
DAT -0.0621
GABAa 0.0610
GABAabz 0.0736
H3 0.0245
M1 0.0879
mGluR5 0.0777
mGluR5 0.0906
mGluR5 0.1215
MOR -0.0416
MOR 0.0048
NET 0.0835
NET 0.1811
VAChT 0.0143
VAChT -0.0073
VAChT 0.0200
Neurosynth topic and term maps
Neurosynth topics - forward inference maps
Test image 1
..cs\v4-topics-100_0_stimulation_somatosensory_tms_pFgA_z_FDR_0.01.nii
_____________________________________________________________________
r_lowest Term_or_Topic_lowest r_highest Term_or_Topic_highest
_________ _____________________________ _________ _____________________________
-0.072766 {'Word Processing' } 0.60286 {'Sensory Stimulation' }
-0.063182 {'Emotion face' } 0.2544 {'Pain Perception' }
-0.062233 {'Familiarity & recognition'} 0.2481 {'Motor movements' }
-0.059672 {'Depression & Disorders' } 0.24004 {'Motor control' }
-0.058889 {'Language comprehension' } 0.07949 {'Motor Coordination' }
-0.057834 {'Reading & Writing' } 0.07842 {'Creativity & Acupuncture '}
-0.056539 {'Cognitive Conflict' } 0.077318 {'Action Observation' }
-0.054691 {'Memory & Events' } 0.038981 {'Auditory processing' }
-0.054037 {'Task-switching' } 0.0095692 {'Multiple Sclerosis' }
-0.053809 {'Encoding & Retrieval' } 0.008167 {'Body perception' }
Neurosynth topics - reverse inference maps
Test image 1
..cs\v4-topics-100_0_stimulation_somatosensory_tms_pFgA_z_FDR_0.01.nii
_____________________________________________________________________
r_lowest Term_or_Topic_lowest r_highest Term_or_Topic_highest
_________ __________________________ ___________ _____________________________
-0.051458 {'Reading & Writing' } 1 {'Sensory Stimulation' }
-0.05124 {'Emotion face' } 0.32365 {'Pain Perception' }
-0.049365 {'Encoding & Retrieval' } 0.31546 {'Motor movements' }
-0.0483 {'Memory & Events' } 0.23224 {'Motor control' }
-0.046738 {'Working Memory' } 0.088103 {'Action Observation' }
-0.044211 {'Word Processing' } 0.04632 {'Motor Coordination' }
-0.04161 {'Language comprehension'} 0.041099 {'Creativity & Acupuncture '}
-0.040511 {'Empathy & Interaction' } 0.027829 {'Auditory processing' }
-0.03783 {'Emotion Processing' } 0.016815 {'Food & weight' }
-0.031803 {'Spatial Attention' } -0.00078825 {'Multiple Sclerosis' }
Neurosynth terms- reverse inference maps
Test image 1
..cs\v4-topics-100_0_stimulation_somatosensory_tms_pFgA_z_FDR_0.01.nii
_____________________________________________________________________
r_lowest Term_or_Topic_lowest r_highest Term_or_Topic_highest
________ ____________________ _________ _____________________
-0.2424 {'memory' } 0.47282 {'somatosensory'}
-0.18946 {'retrieval'} 0.45236 {'tactile' }
-0.18554 {'correct' } 0.42208 {'stimulation' }
-0.18174 {'number' } 0.35855 {'hand' }
-0.17871 {'word' } 0.32351 {'finger' }
-0.17504 {'work' } 0.31912 {'muscle' }
-0.16633 {'verbal' } 0.31753 {'pain' }
-0.16625 {'face' } 0.31062 {'sensory' }
-0.16585 {'words' } 0.30502 {'painful' }
-0.16482 {'encoding' } 0.30338 {'sensorimotor' }
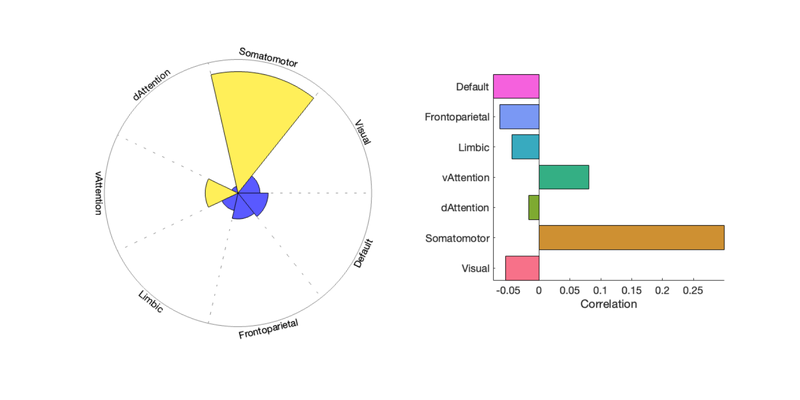
Correlations with Yeo/Bucker resting-state networks
Loaded images:
/Users/f003vz1/Documents/GitHub/CanlabCore/CanlabCore/canlab_canonical_brains/Combined_multiatlas_ROI_masks/rBucknerlab_7clusters_SPMAnat_Other_combined.img
Name Pearson's r
Visual -0.0541
Somatomotor 0.2994
dAttention -0.0167
vAttention 0.0807
Limbic -0.0438
Frontoparietal -0.0638
Default -0.0744
Prepping atlases:
yeo17networks Loading atlas: /Users/f003vz1/Documents/GitHub/Neuroimaging_Pattern_Masks/Atlases_and_parcellations/2018_Schaefer_Yeo_multires_cortical_parcellation/Schaefer2018Cortex_17networks_atlas_object.mat
Note: Mean weights reflect homogeneity in sign and magnitude across region,
not high spatial frequency/pattern information.
____________________________________________________________________________________________________________________________________________
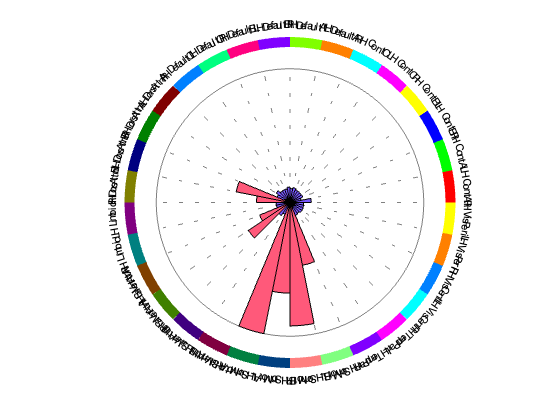
Wedge plot:
Wedge plots depict mean images values across voxels. Red indicates positive values and blue negative values. If multiple images were
entered, the darker shaded area indicates the standard error of the mean (SEM) across individuals.
____________________________________________________________________________________________________________________________________________