Contents
- Loading results and mask
- FDR-corrected results
- Path a results table, FDR-corrected
- Path b results table, FDR-corrected
- Path ab results table, FDR-corrected
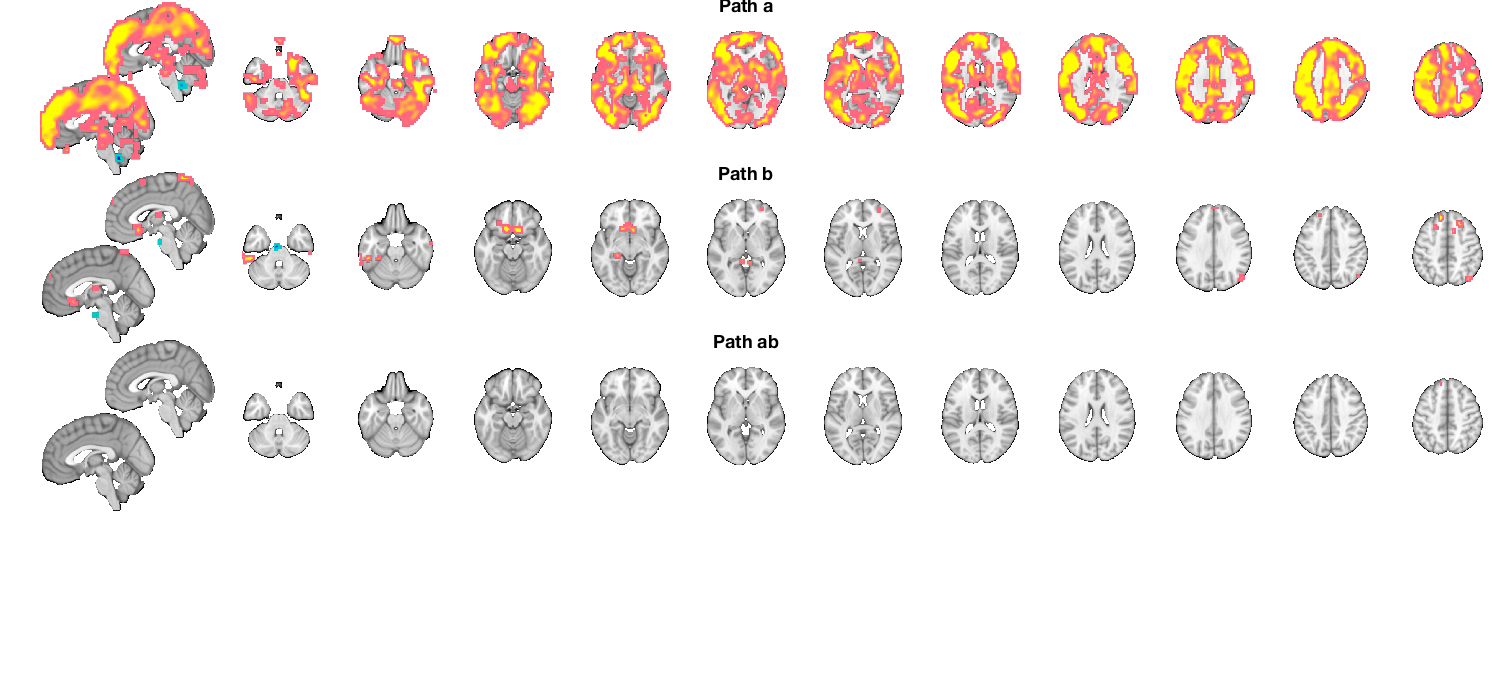
- Combined montage plot with slices, FDR-corrected
- Uncorrected results
- Path a results table, uncorrected
- Path b results table, uncorrected
- Path ab results table, uncorrected
- Montage plot with slices, uncorrected
- Savefile information for objects with extracted data
Loading results and mask
----------------------------------------------------------------
----------------------------------------------
LOADING mediation results and images
----------------------------------------------
Calculating FDR threshold across family of tests in these images:
X-M_pvals.img
M-Y_pvals.img
X-M-Y_pvals.img
Direct calls to spm_defauts are deprecated.
Please use spm('Defaults',modality) or spm_get_defaults instead.
******************************************
Warning! Some p-values are zero.
FDR.m will interpret these as ineligible voxels.
If these are valid p-values, they should have some not-exactly-zero value.
******************************************
Total p-values: 149376
FDR threshold is 0.009734
Saving in SETUP.fdr_p_thresh
----------------------------------------------
Loaded mediation:
----------------------------------------------
cmdstring: 'Search for mediators'
names: {'X:RVLPFC' 'Y:Reappraisal_Success' 'M:BrainMediator'}
mask: '/Users/torwager/Documents/GitHub/CanlabCore/CanlabCore/canlab_canonical_brains/Canonical_brains_surfaces/gray_matter_mask.img'
X: [30×1 double]
Y: [30×1 double]
M: '/Users/torwager/Documents/GitHub/CanlabCore/CanlabCore/Sample_datasets/Wager_et_al_2008_Neuron_EmotionReg/Wager_2008_emo_reg_vs_look_neg_contrast_images.nii.gz'
robust_opt: 'norobust'
boot_opt: 'boot1'
multilev_opt: 'hierarchical'
rank_data: 'No'
covariates: []
covnames: {}
arorder: 0
maskInfo: [1×1 struct]
fdr_p_thresh: 0.0097
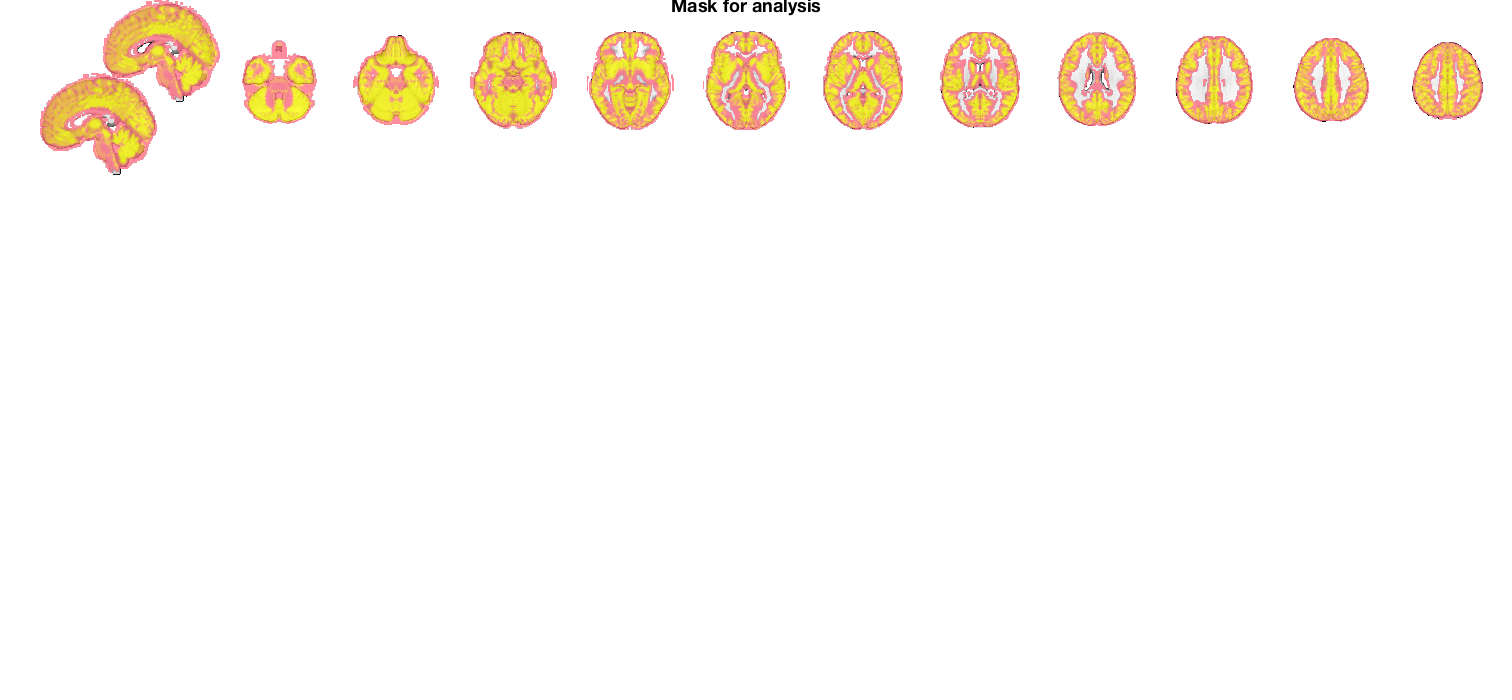
----------------------------------------------
Mask for analysis:
----------------------------------------------
Grouping contiguous voxels: 46 regions
sagittal montage: 8208 voxels displayed, 203131 not displayed on these slices
axial montage: 42172 voxels displayed, 169167 not displayed on these slices

FDR-corrected results
----------------------------------------------------------------
----------------------------------------------
FDR-corrected results
----------------------------------------------
Results corrected across set of a, b, ab images using mediation_brain_corrected_threshold
FDR q < .05 = p < 0.00973413
Path a results table, FDR-corrected
----------------------------------------------
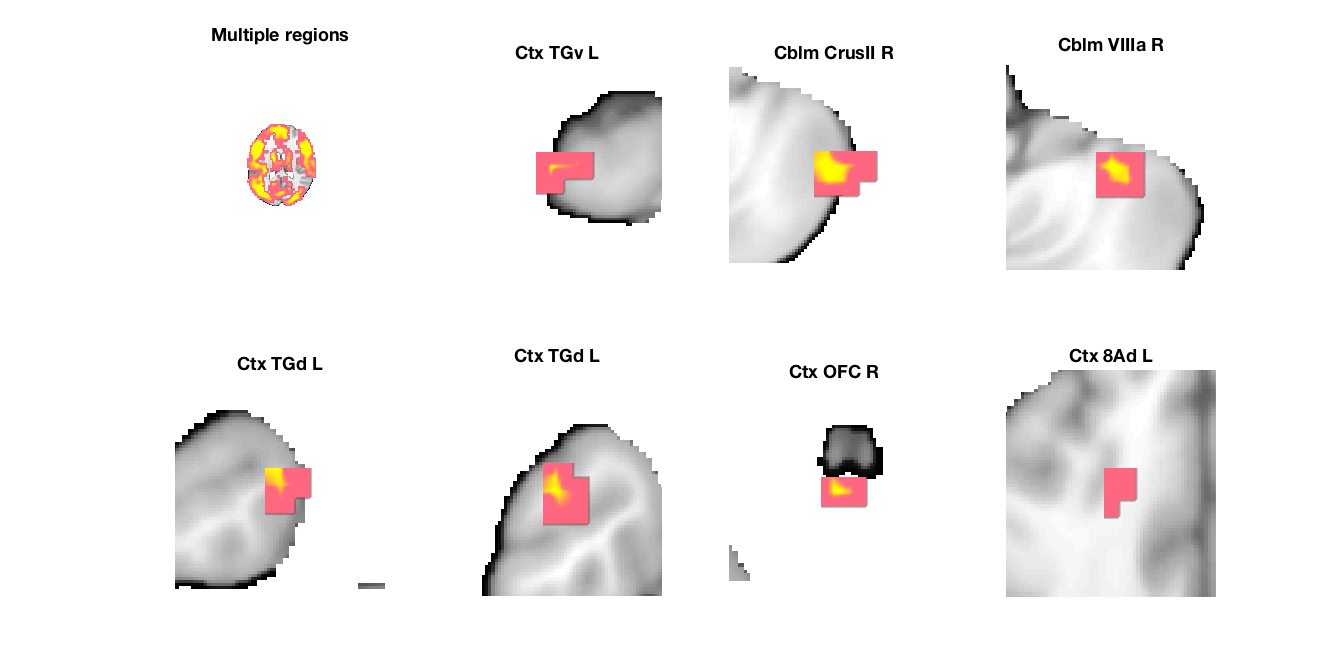
Path a, FDR-corrected q < .05
----------------------------------------------
Image 1
9 contig. clusters, sizes 3 to 17681
Positive effect: 17732 voxels, min p-value: 0.00000000
Negative effect: 10 voxels, min p-value: 0.00219264
> Found image data, extracting region averages.
Spaces for data object and mask object line up, but voxel numbers do not. Check.
> Resampling to mask space first.
Grouping contiguous voxels: 9 regions
____________________________________________________________________________________________________________________________________________
Positive Effects
Region Volume XYZ maxZ modal_label_descriptions Perc_covered_by_label Atlas_regions_covered region_index
__________________ __________ _________________ ______ ________________________ _____________________ _____________________ ____________
'Multiple regions' 1.4841e+06 -7 -17 18 7.0345 'Cerebellum' 1 444 1
'Cblm_CrusII_R' 2032 48 -58 -45 3.847 'Cerebellum' 54 0 3
'Cblm_VIIIa_R' 2008 34 -45 -45 3.5932 'Cerebellum' 41 0 4
'Ctx_8Ad_L' 840 -17 28 36 2.7671 'Cortex_Default_ModeA' 6 0 8
'Ctx_TGd_L' 1184 -24 7 -41 3.2728 'Cortex_Default_ModeB' 38 0 5
'Ctx_TGd_L' 2392 -45 14 -36 3.0216 'Cortex_Default_ModeB' 85 0 6
'Ctx_TGv_L' 1808 -48 0 -45 2.9783 'Cortex_Limbic' 43 0 2
'Ctx_OFC_R' 1624 -3 31 -32 4.0886 'Cortex_Limbic' 19 0 7
Negative Effects
Region Volume XYZ maxZ modal_label_descriptions Perc_covered_by_label Atlas_regions_covered region_index
___________ ______ ________________ _______ ________________________ _____________________ _____________________ ____________
'Cblm_IX_L' 2160 -3 -48 -45 -3.0628 'Cerebellum' 59 0 9
____________________________________________________________________________________________________________________________________________
Regions labeled by reference atlas CANlab_2018_combined
Volume: Volume of contiguous region in cubic mm.
MaxZ: Signed max over Z-score for each voxel.
Atlas_regions_covered: Number of reference atlas regions covered at least 25% by the region. This relates to whether the region covers
multiple reference atlas regions
Region: Best reference atlas label, defined as reference region with highest number of in-region voxels. Regions covering >25% of >5
regions labeled as "Multiple regions"
Perc_covered_by_label: Percentage of the region covered by the label.
Ref_region_perc: Percentage of the label region within the target region.
modal_atlas_index: Index number of label region in reference atlas
all_regions_covered: All regions covered >5% in descending order of importance
For example, if a region is labeled 'TE1a' and Perc_covered_by_label = 8, Ref_region_perc = 38, and Atlas_regions_covered = 17, this means
that 8% of the region's voxels are labeled TE1a, which is the highest percentage among reference label regions. 38% of the region TE1a is
covered by the region. However, the region covers at least 25% of 17 distinct labeled reference regions.
References for atlases:
Beliveau, Vincent, Claus Svarer, Vibe G. Frokjaer, Gitte M. Knudsen, Douglas N. Greve, and Patrick M. Fisher. 2015. “Functional
Connectivity of the Dorsal and Median Raphe Nuclei at Rest.” NeuroImage 116 (August): 187–95.
Bär, Karl-Jürgen, Feliberto de la Cruz, Andy Schumann, Stefanie Koehler, Heinrich Sauer, Hugo Critchley, and Gerd Wagner. 2016. ?Functional
Connectivity and Network Analysis of Midbrain and Brainstem Nuclei.? NeuroImage 134 (July):53?63.
Diedrichsen, Jörn, Joshua H. Balsters, Jonathan Flavell, Emma Cussans, and Narender Ramnani. 2009. A Probabilistic MR Atlas of the Human
Cerebellum. NeuroImage 46 (1): 39?46.
Fairhurst, Merle, Katja Wiech, Paul Dunckley, and Irene Tracey. 2007. ?Anticipatory Brainstem Activity Predicts Neural Processing of Pain
in Humans.? Pain 128 (1-2):101?10.
Fan 2016 Cerebral Cortex; doi:10.1093/cercor/bhw157
Glasser, Matthew F., Timothy S. Coalson, Emma C. Robinson, Carl D. Hacker, John Harwell, Essa Yacoub, Kamil Ugurbil, et al. 2016. A
Multi-Modal Parcellation of Human Cerebral Cortex. Nature 536 (7615): 171?78.
Keren, Noam I., Carl T. Lozar, Kelly C. Harris, Paul S. Morgan, and Mark A. Eckert. 2009. “In Vivo Mapping of the Human Locus Coeruleus.”
NeuroImage 47 (4): 1261–67.
Keuken, M. C., P-L Bazin, L. Crown, J. Hootsmans, A. Laufer, C. Müller-Axt, R. Sier, et al. 2014. “Quantifying Inter-Individual Anatomical
Variability in the Subcortex Using 7 T Structural MRI.” NeuroImage 94 (July): 40–46.
Krauth A, Blanc R, Poveda A, Jeanmonod D, Morel A, Székely G. (2010) A mean three-dimensional atlas of the human thalamus: generation from
multiple histological data. Neuroimage. 2010 Feb 1;49(3):2053-62. Jakab A, Blanc R, Berényi EL, Székely G. (2012) Generation of
Individualized Thalamus Target Maps by Using Statistical Shape Models and Thalamocortical Tractography. AJNR Am J Neuroradiol. 33:
2110-2116, doi: 10.3174/ajnr.A3140
Nash, Paul G., Vaughan G. Macefield, Iven J. Klineberg, Greg M. Murray, and Luke A. Henderson. 2009. ?Differential Activation of the Human
Trigeminal Nuclear Complex by Noxious and Non-Noxious Orofacial Stimulation.? Human Brain Mapping 30 (11):3772?82.
Pauli 2018 Bioarxiv: CIT168 from Human Connectome Project data
Pauli, Wolfgang M., Amanda N. Nili, and J. Michael Tyszka. 2018. ?A High-Resolution Probabilistic in Vivo Atlas of Human Subcortical Brain
Nuclei.? Scientific Data 5 (April): 180063.
Pauli, Wolfgang M., Randall C. O?Reilly, Tal Yarkoni, and Tor D. Wager. 2016. ?Regional Specialization within the Human Striatum for
Diverse Psychological Functions.? Proceedings of the National Academy of Sciences of the United States of America 113 (7): 1907?12.
Sclocco, Roberta, Florian Beissner, Gaelle Desbordes, Jonathan R. Polimeni, Lawrence L. Wald, Norman W. Kettner, Jieun Kim, et al. 2016.
?Neuroimaging Brainstem Circuitry Supporting Cardiovagal Response to Pain: A Combined Heart Rate Variability/ultrahigh-Field (7 T)
Functional Magnetic Resonance Imaging Study.? Philosophical Transactions. Series A, Mathematical, Physical, and Engineering Sciences 374
(2067). rsta.royalsocietypublishing.org. https://doi.org/10.1098/rsta.2015.0189.
Shen, X., F. Tokoglu, X. Papademetris, and R. T. Constable. 2013. “Groupwise Whole-Brain Parcellation from Resting-State fMRI Data for
Network Node Identification.” NeuroImage 82 (November): 403–15.
Zambreanu, L., R. G. Wise, J. C. W. Brooks, G. D. Iannetti, and I. Tracey. 2005. ?A Role for the Brainstem in Central Sensitisation in
Humans. Evidence from Functional Magnetic Resonance Imaging.? Pain 114 (3):397?407.
Note: Region object r(i).title contains full list of reference atlas regions covered by each cluster.
____________________________________________________________________________________________________________________________________________

Path b results table, FDR-corrected
----------------------------------------------
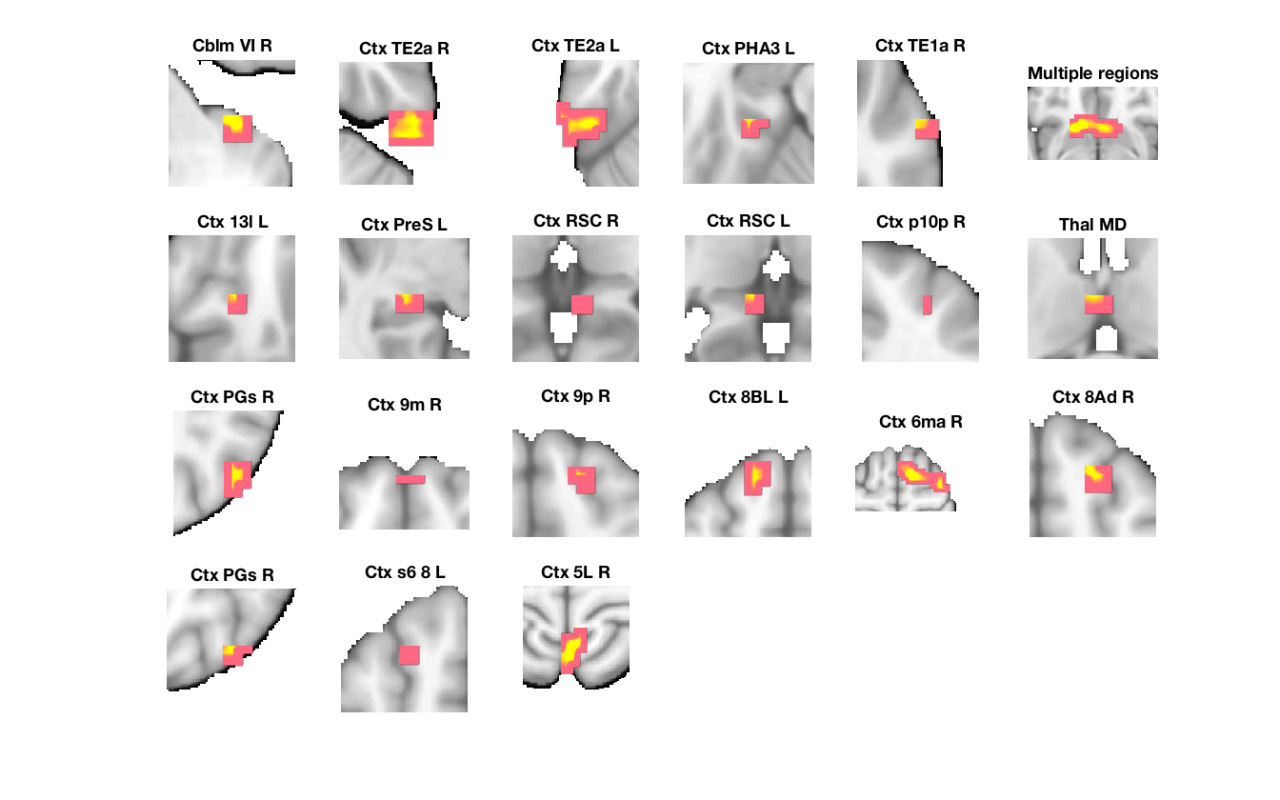
Path b, FDR-corrected q < .05
----------------------------------------------
Image 1
22 contig. clusters, sizes 3 to 88
Positive effect: 359 voxels, min p-value: 0.00019283
Negative effect: 6 voxels, min p-value: 0.00252088
> Found image data, extracting region averages.
Spaces for data object and mask object line up, but voxel numbers do not. Check.
> Resampling to mask space first.
fmri_data.extract_roi_averages: Defining mask object.
Grouping contiguous voxels: 22 regions
Averaging data. Done.
____________________________________________________________________________________________________________________________________________
Positive Effects
Region Volume XYZ maxZ modal_label_descriptions Perc_covered_by_label Atlas_regions_covered region_index
__________________ ______ _________________ ______ ___________________________ _____________________ _____________________ ____________
'Multiple regions' 12368 -3 17 -9 3.5015 'Basal_ganglia' 16 8 6
'Cblm_VI_R' 2912 34 -38 -36 3.096 'Cerebellum' 63 0 1
'Ctx_TE1a_R' 1392 62 -7 -18 2.8368 'Cortex_Default_ModeA' 60 0 5
'Ctx_RSC_R' 672 7 -41 5 3.0206 'Cortex_Default_ModeA' 39 0 9
'Ctx_PGs_R' 2928 48 -69 36 3.0278 'Cortex_Default_ModeA' 26 0 13
'Ctx_9m_R' 1032 0 58 32 2.9109 'Cortex_Default_ModeA' 57 0 14
'Ctx_8Ad_R' 1856 21 28 50 3.127 'Cortex_Default_ModeA' 59 1 18
'Ctx_PGs_R' 1680 38 -69 50 2.9155 'Cortex_Default_ModeA' 35 0 19
'Ctx_s6_8_L' 1176 -24 21 54 2.8251 'Cortex_Default_ModeA' 29 0 20
'Ctx_9p_R' 1120 17 45 36 3.0376 'Cortex_Default_ModeB' 82 1 15
'Ctx_8BL_L' 3152 -14 41 50 3.4422 'Cortex_Default_ModeB' 35 1 16
'Ctx_PHA3_L' 1576 -31 -31 -18 3.2328 'Cortex_Default_ModeC' 32 1 4
'Ctx_PreS_L' 1480 -24 -28 -5 3.0675 'Cortex_Default_ModeC' 23 0 8
'Ctx_RSC_L' 1024 -7 -38 5 2.8733 'Cortex_Default_ModeC' 10 0 10
'Ctx_5L_R' 5128 3 -48 68 3.7208 'Cortex_Dorsal_AttentionB' 27 2 21
'Ctx_p10p_R' 792 28 55 9 2.6688 'Cortex_Fronto_ParietalB' 56 0 11
'Ctx_TE2a_R' 3568 52 -28 -32 3.4164 'Cortex_Limbic' 23 0 2
'Ctx_TE2a_L' 5480 -58 -34 -27 3.5549 'Cortex_Limbic' 20 1 3
'Ctx_13l_L' 1392 -24 28 -14 2.6654 'Cortex_Limbic' 79 1 7
'Ctx_6ma_R' 11424 21 3 63 3.7282 'Cortex_Ventral_AttentionA' 19 3 17
'Thal_MD' 1400 -3 -10 14 2.8096 'Diencephalon' 43 1 12
Negative Effects
Region Volume XYZ maxZ modal_label_descriptions Perc_covered_by_label Atlas_regions_covered region_index
______________ ______ ________________ _______ ________________________ _____________________ _____________________ ____________
'Bstem_Pons_L' 1184 -3 -14 -27 -3.0208 'Brainstem' 61 0 22
____________________________________________________________________________________________________________________________________________
Regions labeled by reference atlas CANlab_2018_combined
Volume: Volume of contiguous region in cubic mm.
MaxZ: Signed max over Z-score for each voxel.
Atlas_regions_covered: Number of reference atlas regions covered at least 25% by the region. This relates to whether the region covers
multiple reference atlas regions
Region: Best reference atlas label, defined as reference region with highest number of in-region voxels. Regions covering >25% of >5
regions labeled as "Multiple regions"
Perc_covered_by_label: Percentage of the region covered by the label.
Ref_region_perc: Percentage of the label region within the target region.
modal_atlas_index: Index number of label region in reference atlas
all_regions_covered: All regions covered >5% in descending order of importance
For example, if a region is labeled 'TE1a' and Perc_covered_by_label = 8, Ref_region_perc = 38, and Atlas_regions_covered = 17, this means
that 8% of the region's voxels are labeled TE1a, which is the highest percentage among reference label regions. 38% of the region TE1a is
covered by the region. However, the region covers at least 25% of 17 distinct labeled reference regions.
References for atlases:
Beliveau, Vincent, Claus Svarer, Vibe G. Frokjaer, Gitte M. Knudsen, Douglas N. Greve, and Patrick M. Fisher. 2015. “Functional
Connectivity of the Dorsal and Median Raphe Nuclei at Rest.” NeuroImage 116 (August): 187–95.
Bär, Karl-Jürgen, Feliberto de la Cruz, Andy Schumann, Stefanie Koehler, Heinrich Sauer, Hugo Critchley, and Gerd Wagner. 2016. ?Functional
Connectivity and Network Analysis of Midbrain and Brainstem Nuclei.? NeuroImage 134 (July):53?63.
Diedrichsen, Jörn, Joshua H. Balsters, Jonathan Flavell, Emma Cussans, and Narender Ramnani. 2009. A Probabilistic MR Atlas of the Human
Cerebellum. NeuroImage 46 (1): 39?46.
Fairhurst, Merle, Katja Wiech, Paul Dunckley, and Irene Tracey. 2007. ?Anticipatory Brainstem Activity Predicts Neural Processing of Pain
in Humans.? Pain 128 (1-2):101?10.
Fan 2016 Cerebral Cortex; doi:10.1093/cercor/bhw157
Glasser, Matthew F., Timothy S. Coalson, Emma C. Robinson, Carl D. Hacker, John Harwell, Essa Yacoub, Kamil Ugurbil, et al. 2016. A
Multi-Modal Parcellation of Human Cerebral Cortex. Nature 536 (7615): 171?78.
Keren, Noam I., Carl T. Lozar, Kelly C. Harris, Paul S. Morgan, and Mark A. Eckert. 2009. “In Vivo Mapping of the Human Locus Coeruleus.”
NeuroImage 47 (4): 1261–67.
Keuken, M. C., P-L Bazin, L. Crown, J. Hootsmans, A. Laufer, C. Müller-Axt, R. Sier, et al. 2014. “Quantifying Inter-Individual Anatomical
Variability in the Subcortex Using 7 T Structural MRI.” NeuroImage 94 (July): 40–46.
Krauth A, Blanc R, Poveda A, Jeanmonod D, Morel A, Székely G. (2010) A mean three-dimensional atlas of the human thalamus: generation from
multiple histological data. Neuroimage. 2010 Feb 1;49(3):2053-62. Jakab A, Blanc R, Berényi EL, Székely G. (2012) Generation of
Individualized Thalamus Target Maps by Using Statistical Shape Models and Thalamocortical Tractography. AJNR Am J Neuroradiol. 33:
2110-2116, doi: 10.3174/ajnr.A3140
Nash, Paul G., Vaughan G. Macefield, Iven J. Klineberg, Greg M. Murray, and Luke A. Henderson. 2009. ?Differential Activation of the Human
Trigeminal Nuclear Complex by Noxious and Non-Noxious Orofacial Stimulation.? Human Brain Mapping 30 (11):3772?82.
Pauli 2018 Bioarxiv: CIT168 from Human Connectome Project data
Pauli, Wolfgang M., Amanda N. Nili, and J. Michael Tyszka. 2018. ?A High-Resolution Probabilistic in Vivo Atlas of Human Subcortical Brain
Nuclei.? Scientific Data 5 (April): 180063.
Pauli, Wolfgang M., Randall C. O?Reilly, Tal Yarkoni, and Tor D. Wager. 2016. ?Regional Specialization within the Human Striatum for
Diverse Psychological Functions.? Proceedings of the National Academy of Sciences of the United States of America 113 (7): 1907?12.
Sclocco, Roberta, Florian Beissner, Gaelle Desbordes, Jonathan R. Polimeni, Lawrence L. Wald, Norman W. Kettner, Jieun Kim, et al. 2016.
?Neuroimaging Brainstem Circuitry Supporting Cardiovagal Response to Pain: A Combined Heart Rate Variability/ultrahigh-Field (7 T)
Functional Magnetic Resonance Imaging Study.? Philosophical Transactions. Series A, Mathematical, Physical, and Engineering Sciences 374
(2067). rsta.royalsocietypublishing.org. https://doi.org/10.1098/rsta.2015.0189.
Shen, X., F. Tokoglu, X. Papademetris, and R. T. Constable. 2013. “Groupwise Whole-Brain Parcellation from Resting-State fMRI Data for
Network Node Identification.” NeuroImage 82 (November): 403–15.
Zambreanu, L., R. G. Wise, J. C. W. Brooks, G. D. Iannetti, and I. Tracey. 2005. ?A Role for the Brainstem in Central Sensitisation in
Humans. Evidence from Functional Magnetic Resonance Imaging.? Pain 114 (3):397?407.
Note: Region object r(i).title contains full list of reference atlas regions covered by each cluster.
____________________________________________________________________________________________________________________________________________

Path ab results table, FDR-corrected
----------------------------------------------
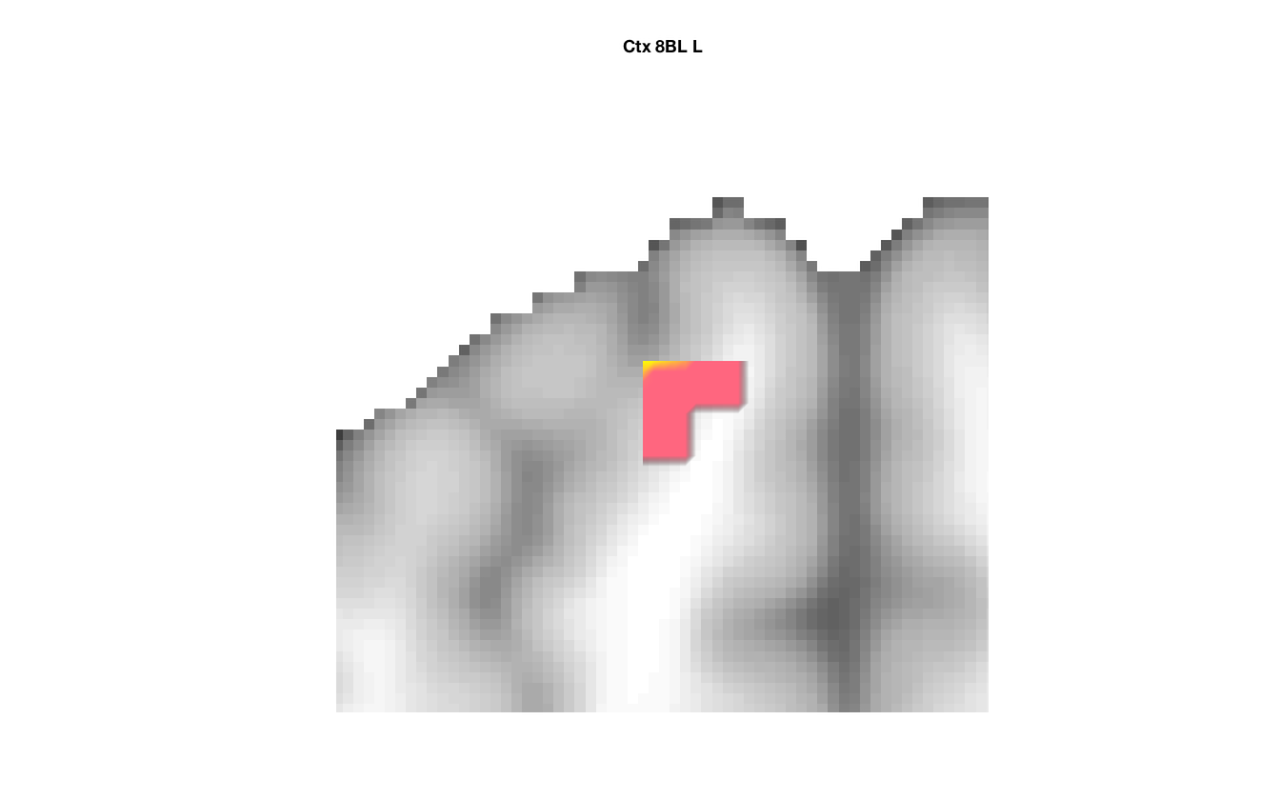
Path ab, FDR-corrected q < .05
----------------------------------------------
Image 1
1 contig. clusters, sizes 4 to 4
Positive effect: 4 voxels, min p-value: 0.00332451
Negative effect: 0 voxels, min p-value: 0.00947906
> Found image data, extracting region averages.
Spaces for data object and mask object line up, but voxel numbers do not. Check.
> Resampling to mask space first.
fmri_data.extract_roi_averages: Defining mask object.
Grouping contiguous voxels: 1 regions
Averaging data. Done.
____________________________________________________________________________________________________________________________________________
Positive Effects
Region Volume XYZ maxZ modal_label_descriptions Perc_covered_by_label Atlas_regions_covered region_index
___________ ______ _________________ _____ ________________________ _____________________ _____________________ ____________
'Ctx_8BL_L' 1376 -14 45 45 2.936 'Cortex_Default_ModeB' 35 0 1
Negative Effects
No regions to display
____________________________________________________________________________________________________________________________________________
Regions labeled by reference atlas CANlab_2018_combined
Volume: Volume of contiguous region in cubic mm.
MaxZ: Signed max over Z-score for each voxel.
Atlas_regions_covered: Number of reference atlas regions covered at least 25% by the region. This relates to whether the region covers
multiple reference atlas regions
Region: Best reference atlas label, defined as reference region with highest number of in-region voxels. Regions covering >25% of >5
regions labeled as "Multiple regions"
Perc_covered_by_label: Percentage of the region covered by the label.
Ref_region_perc: Percentage of the label region within the target region.
modal_atlas_index: Index number of label region in reference atlas
all_regions_covered: All regions covered >5% in descending order of importance
For example, if a region is labeled 'TE1a' and Perc_covered_by_label = 8, Ref_region_perc = 38, and Atlas_regions_covered = 17, this means
that 8% of the region's voxels are labeled TE1a, which is the highest percentage among reference label regions. 38% of the region TE1a is
covered by the region. However, the region covers at least 25% of 17 distinct labeled reference regions.
References for atlases:
Beliveau, Vincent, Claus Svarer, Vibe G. Frokjaer, Gitte M. Knudsen, Douglas N. Greve, and Patrick M. Fisher. 2015. “Functional
Connectivity of the Dorsal and Median Raphe Nuclei at Rest.” NeuroImage 116 (August): 187–95.
Bär, Karl-Jürgen, Feliberto de la Cruz, Andy Schumann, Stefanie Koehler, Heinrich Sauer, Hugo Critchley, and Gerd Wagner. 2016. ?Functional
Connectivity and Network Analysis of Midbrain and Brainstem Nuclei.? NeuroImage 134 (July):53?63.
Diedrichsen, Jörn, Joshua H. Balsters, Jonathan Flavell, Emma Cussans, and Narender Ramnani. 2009. A Probabilistic MR Atlas of the Human
Cerebellum. NeuroImage 46 (1): 39?46.
Fairhurst, Merle, Katja Wiech, Paul Dunckley, and Irene Tracey. 2007. ?Anticipatory Brainstem Activity Predicts Neural Processing of Pain
in Humans.? Pain 128 (1-2):101?10.
Fan 2016 Cerebral Cortex; doi:10.1093/cercor/bhw157
Glasser, Matthew F., Timothy S. Coalson, Emma C. Robinson, Carl D. Hacker, John Harwell, Essa Yacoub, Kamil Ugurbil, et al. 2016. A
Multi-Modal Parcellation of Human Cerebral Cortex. Nature 536 (7615): 171?78.
Keren, Noam I., Carl T. Lozar, Kelly C. Harris, Paul S. Morgan, and Mark A. Eckert. 2009. “In Vivo Mapping of the Human Locus Coeruleus.”
NeuroImage 47 (4): 1261–67.
Keuken, M. C., P-L Bazin, L. Crown, J. Hootsmans, A. Laufer, C. Müller-Axt, R. Sier, et al. 2014. “Quantifying Inter-Individual Anatomical
Variability in the Subcortex Using 7 T Structural MRI.” NeuroImage 94 (July): 40–46.
Krauth A, Blanc R, Poveda A, Jeanmonod D, Morel A, Székely G. (2010) A mean three-dimensional atlas of the human thalamus: generation from
multiple histological data. Neuroimage. 2010 Feb 1;49(3):2053-62. Jakab A, Blanc R, Berényi EL, Székely G. (2012) Generation of
Individualized Thalamus Target Maps by Using Statistical Shape Models and Thalamocortical Tractography. AJNR Am J Neuroradiol. 33:
2110-2116, doi: 10.3174/ajnr.A3140
Nash, Paul G., Vaughan G. Macefield, Iven J. Klineberg, Greg M. Murray, and Luke A. Henderson. 2009. ?Differential Activation of the Human
Trigeminal Nuclear Complex by Noxious and Non-Noxious Orofacial Stimulation.? Human Brain Mapping 30 (11):3772?82.
Pauli 2018 Bioarxiv: CIT168 from Human Connectome Project data
Pauli, Wolfgang M., Amanda N. Nili, and J. Michael Tyszka. 2018. ?A High-Resolution Probabilistic in Vivo Atlas of Human Subcortical Brain
Nuclei.? Scientific Data 5 (April): 180063.
Pauli, Wolfgang M., Randall C. O?Reilly, Tal Yarkoni, and Tor D. Wager. 2016. ?Regional Specialization within the Human Striatum for
Diverse Psychological Functions.? Proceedings of the National Academy of Sciences of the United States of America 113 (7): 1907?12.
Sclocco, Roberta, Florian Beissner, Gaelle Desbordes, Jonathan R. Polimeni, Lawrence L. Wald, Norman W. Kettner, Jieun Kim, et al. 2016.
?Neuroimaging Brainstem Circuitry Supporting Cardiovagal Response to Pain: A Combined Heart Rate Variability/ultrahigh-Field (7 T)
Functional Magnetic Resonance Imaging Study.? Philosophical Transactions. Series A, Mathematical, Physical, and Engineering Sciences 374
(2067). rsta.royalsocietypublishing.org. https://doi.org/10.1098/rsta.2015.0189.
Shen, X., F. Tokoglu, X. Papademetris, and R. T. Constable. 2013. “Groupwise Whole-Brain Parcellation from Resting-State fMRI Data for
Network Node Identification.” NeuroImage 82 (November): 403–15.
Zambreanu, L., R. G. Wise, J. C. W. Brooks, G. D. Iannetti, and I. Tracey. 2005. ?A Role for the Brainstem in Central Sensitisation in
Humans. Evidence from Functional Magnetic Resonance Imaging.? Pain 114 (3):397?407.
Note: Region object r(i).title contains full list of reference atlas regions covered by each cluster.
____________________________________________________________________________________________________________________________________________

Combined montage plot with slices, FDR-corrected
Grouping contiguous voxels:   9 regions
sagittal montage: 1063 voxels displayed, 16679 not displayed on these slices
axial montage: 8770 voxels displayed, 8972 not displayed on these slices
Grouping contiguous voxels:  22 regions
sagittal montage:  35 voxels displayed, 330 not displayed on these slices
axial montage: 141 voxels displayed, 224 not displayed on these slices
Grouping contiguous voxels:   1 regions
sagittal montage:   0 voxels displayed,   4 not displayed on these slices
axial montage:   1 voxels displayed,   3 not displayed on these slices


Uncorrected results
----------------------------------------------------------------
----------------------------------------------
Uncorrected (p < .01)  results
----------------------------------------------
Path a results table, uncorrected
----------------------------------------------
Path a, Uncorrected (p < .01)
----------------------------------------------

Image   1
  9 contig. clusters, sizes   3 to 17789
Positive effect: 17842 voxels, min p-value: 0.00000000
Negative effect:  10 voxels, min p-value: 0.00219264
> Found image data, extracting region averages.
Spaces for data object and mask object line up, but voxel numbers do not. Check.
> Resampling to mask space first.
fmri_data.extract_roi_averages: Defining mask object.
Grouping contiguous voxels:   9 regions
Averaging data. Done.

____________________________________________________________________________________________________________________________________________
Positive Effects
          Region            Volume             XYZ            maxZ     modal_label_descriptions    Perc_covered_by_label    Atlas_regions_covered    region_index
    __________________    __________    _________________    ______    ________________________    _____________________    _____________________    ____________

    'Multiple regions'    1.4902e+06     -7    -17     18    7.0345     'Cerebellum'                         1                       444                  1
    'Cblm_CrusII_R'             2112     48    -58    -45     3.847     'Cerebellum'                        55                         0                  3
    'Cblm_VIIIa_R'              2008     34    -45    -45    3.5932     'Cerebellum'                        41                         0                  4
    'Ctx_8Ad_L'                  840    -17     28     36    2.7671     'Cortex_Default_ModeA'               6                         0                  8
    'Ctx_TGd_L'                 1184    -24      7    -41    3.2728     'Cortex_Default_ModeB'              38                         0                  5
    'Ctx_TGd_L'                 2552    -45     10    -36    3.0216     'Cortex_Default_ModeB'              81                         0                  6
    'Ctx_TGv_L'                 1776    -48      0    -45    2.9783     'Cortex_Limbic'                     43                         0                  2
    'Ctx_OFC_R'                 1624     -3     31    -32    4.0886     'Cortex_Limbic'                     19                         0                  7


Negative Effects
      Region       Volume          XYZ            maxZ      modal_label_descriptions    Perc_covered_by_label    Atlas_regions_covered    region_index
    ___________    ______    ________________    _______    ________________________    _____________________    _____________________    ____________

    'Cblm_IX_L'     2160     -3    -48    -45    -3.0628          'Cerebellum'                   59                        0                   9


____________________________________________________________________________________________________________________________________________
Regions labeled by reference atlas CANlab_2018_combined

Volume: Volume of contiguous region in cubic mm.
MaxZ: Signed max over Z-score for each voxel.
Atlas_regions_covered: Number of reference atlas regions covered at least 25% by the region. This relates to whether the region covers
multiple reference atlas regions
Region: Best reference atlas label, defined as reference region with highest number of in-region voxels. Regions covering >25% of >5
regions labeled as "Multiple regions"
Perc_covered_by_label: Percentage of the region covered by the label.
Ref_region_perc: Percentage of the label region within the target region.
modal_atlas_index: Index number of label region in reference atlas
all_regions_covered: All regions covered >5% in descending order of importance

For example, if a region is labeled 'TE1a' and Perc_covered_by_label = 8, Ref_region_perc = 38, and Atlas_regions_covered = 17, this means
that 8% of the region's voxels are labeled TE1a, which is the highest percentage among reference label regions. 38% of the region TE1a is
covered by the region. However, the region covers at least 25% of 17 distinct labeled reference regions.

References for atlases:

Beliveau, Vincent, Claus Svarer, Vibe G. Frokjaer, Gitte M. Knudsen, Douglas N. Greve, and Patrick M. Fisher. 2015. “Functional
Connectivity of the Dorsal and Median Raphe Nuclei at Rest.” NeuroImage 116 (August): 187–95.
Bär, Karl-Jürgen, Feliberto de la Cruz, Andy Schumann, Stefanie Koehler, Heinrich Sauer, Hugo Critchley, and Gerd Wagner. 2016. ?Functional
Connectivity and Network Analysis of Midbrain and Brainstem Nuclei.? NeuroImage 134 (July):53?63.
Diedrichsen, Jörn, Joshua H. Balsters, Jonathan Flavell, Emma Cussans, and Narender Ramnani. 2009. A Probabilistic MR Atlas of the Human
Cerebellum. NeuroImage 46 (1): 39?46.
Fairhurst, Merle, Katja Wiech, Paul Dunckley, and Irene Tracey. 2007. ?Anticipatory Brainstem Activity Predicts Neural Processing of Pain
in Humans.? Pain 128 (1-2):101?10.
Fan 2016 Cerebral Cortex; doi:10.1093/cercor/bhw157
Glasser, Matthew F., Timothy S. Coalson, Emma C. Robinson, Carl D. Hacker, John Harwell, Essa Yacoub, Kamil Ugurbil, et al. 2016. A
Multi-Modal Parcellation of Human Cerebral Cortex. Nature 536 (7615): 171?78.
Keren, Noam I., Carl T. Lozar, Kelly C. Harris, Paul S. Morgan, and Mark A. Eckert. 2009. “In Vivo Mapping of the Human Locus Coeruleus.”
NeuroImage 47 (4): 1261–67.
Keuken, M. C., P-L Bazin, L. Crown, J. Hootsmans, A. Laufer, C. Müller-Axt, R. Sier, et al. 2014. “Quantifying Inter-Individual Anatomical
Variability in the Subcortex Using 7 T Structural MRI.” NeuroImage 94 (July): 40–46.
Krauth A, Blanc R, Poveda A, Jeanmonod D, Morel A, Székely G. (2010) A mean three-dimensional atlas of the human thalamus: generation from
multiple histological data. Neuroimage. 2010 Feb 1;49(3):2053-62. Jakab A, Blanc R, Berényi EL, Székely G. (2012) Generation of
Individualized Thalamus Target Maps by Using Statistical Shape Models and Thalamocortical Tractography. AJNR Am J Neuroradiol. 33:
2110-2116, doi: 10.3174/ajnr.A3140
Nash, Paul G., Vaughan G. Macefield, Iven J. Klineberg, Greg M. Murray, and Luke A. Henderson. 2009. ?Differential Activation of the Human
Trigeminal Nuclear Complex by Noxious and Non-Noxious Orofacial Stimulation.? Human Brain Mapping 30 (11):3772?82.
Pauli 2018 Bioarxiv: CIT168 from Human Connectome Project data
Pauli, Wolfgang M., Amanda N. Nili, and J. Michael Tyszka. 2018. ?A High-Resolution Probabilistic in Vivo Atlas of Human Subcortical Brain
Nuclei.? Scientific Data 5 (April): 180063.
Pauli, Wolfgang M., Randall C. O?Reilly, Tal Yarkoni, and Tor D. Wager. 2016. ?Regional Specialization within the Human Striatum for
Diverse Psychological Functions.? Proceedings of the National Academy of Sciences of the United States of America 113 (7): 1907?12.
Sclocco, Roberta, Florian Beissner, Gaelle Desbordes, Jonathan R. Polimeni, Lawrence L. Wald, Norman W. Kettner, Jieun Kim, et al. 2016.
?Neuroimaging Brainstem Circuitry Supporting Cardiovagal Response to Pain: A Combined Heart Rate Variability/ultrahigh-Field (7 T)
Functional Magnetic Resonance Imaging Study.? Philosophical Transactions. Series A, Mathematical, Physical, and Engineering Sciences 374
(2067). rsta.royalsocietypublishing.org. https://doi.org/10.1098/rsta.2015.0189.
Shen, X., F. Tokoglu, X. Papademetris, and R. T. Constable. 2013. “Groupwise Whole-Brain Parcellation from Resting-State fMRI Data for
Network Node Identification.” NeuroImage 82 (November): 403–15.
Zambreanu, L., R. G. Wise, J. C. W. Brooks, G. D. Iannetti, and I. Tracey. 2005. ?A Role for the Brainstem in Central Sensitisation in
Humans. Evidence from Functional Magnetic Resonance Imaging.? Pain 114 (3):397?407.

Note: Region object r(i).title contains full list of reference atlas regions covered by each cluster.
____________________________________________________________________________________________________________________________________________
Path b results table, uncorrected
----------------------------------------------
Path b, Uncorrected (p < .01)
----------------------------------------------

Image   1
 22 contig. clusters, sizes   3 to  93
Positive effect: 369 voxels, min p-value: 0.00019283
Negative effect:   6 voxels, min p-value: 0.00252088
> Found image data, extracting region averages.
Spaces for data object and mask object line up, but voxel numbers do not. Check.
> Resampling to mask space first.
fmri_data.extract_roi_averages: Defining mask object.
Grouping contiguous voxels:  22 regions
Averaging data. Done.

____________________________________________________________________________________________________________________________________________
Positive Effects
          Region          Volume           XYZ            maxZ      modal_label_descriptions      Perc_covered_by_label    Atlas_regions_covered    region_index
    __________________    ______    _________________    ______    ___________________________    _____________________    _____________________    ____________

    'Multiple regions'    13104      -3     17     -9    3.5015    'Basal_ganglia'                         16                        8                    6
    'Cblm_VI_R'            2912      34    -38    -36     3.096    'Cerebellum'                            63                        0                    1
    'Ctx_TE1a_R'           1392      62     -7    -18    2.8368    'Cortex_Default_ModeA'                  60                        0                    5
    'Ctx_RSC_R'             672       7    -41      5    3.0206    'Cortex_Default_ModeA'                  39                        0                    9
    'Ctx_PGs_R'            2928      48    -69     36    3.0278    'Cortex_Default_ModeA'                  26                        0                   13
    'Ctx_9m_R'             1032       0     58     32    2.9109    'Cortex_Default_ModeA'                  57                        0                   14
    'Ctx_8Ad_R'            1856      21     28     50     3.127    'Cortex_Default_ModeA'                  59                        1                   18
    'Ctx_PGs_R'            1680      38    -69     50    2.9155    'Cortex_Default_ModeA'                  35                        0                   19
    'Ctx_s6_8_L'           1176     -24     21     54    2.8251    'Cortex_Default_ModeA'                  29                        0                   20
    'Ctx_9p_R'             1120      17     45     36    3.0376    'Cortex_Default_ModeB'                  82                        1                   15
    'Ctx_8BL_L'            3152     -14     41     50    3.4422    'Cortex_Default_ModeB'                  35                        1                   16
    'Ctx_PHA3_L'           1576     -31    -31    -18    3.2328    'Cortex_Default_ModeC'                  32                        1                    4
    'Ctx_PreS_L'           1480     -24    -28     -5    3.0675    'Cortex_Default_ModeC'                  23                        0                    8
    'Ctx_RSC_L'            1088      -7    -38      5    2.8733    'Cortex_Default_ModeC'                  10                        0                   10
    'Ctx_5L_R'             5384       3    -48     68    3.7208    'Cortex_Dorsal_AttentionB'              30                        2                   21
    'Ctx_p10p_R'            792      28     55      9    2.6688    'Cortex_Fronto_ParietalB'               56                        0                   11
    'Ctx_TE2a_R'           3568      52    -28    -32    3.4164    'Cortex_Limbic'                         23                        0                    2
    'Ctx_TE2a_L'           5544     -58    -34    -27    3.5549    'Cortex_Limbic'                         20                        2                    3
    'Ctx_13l_L'            1392     -24     28    -14    2.6654    'Cortex_Limbic'                         79                        1                    7
    'Ctx_6ma_R'           11488      21      3     63    3.7282    'Cortex_Ventral_AttentionA'             19                        3                   17
    'Thal_MD'              1400      -3    -10     14    2.8096    'Diencephalon'                          43                        1                   12


Negative Effects
        Region        Volume          XYZ            maxZ      modal_label_descriptions    Perc_covered_by_label    Atlas_regions_covered    region_index
    ______________    ______    ________________    _______    ________________________    _____________________    _____________________    ____________

    'Bstem_Pons_L'     1184     -3    -14    -27    -3.0208          'Brainstem'                    61                        0                   22


____________________________________________________________________________________________________________________________________________
Regions labeled by reference atlas CANlab_2018_combined

Volume: Volume of contiguous region in cubic mm.
MaxZ: Signed max over Z-score for each voxel.
Atlas_regions_covered: Number of reference atlas regions covered at least 25% by the region. This relates to whether the region covers
multiple reference atlas regions
Region: Best reference atlas label, defined as reference region with highest number of in-region voxels. Regions covering >25% of >5
regions labeled as "Multiple regions"
Perc_covered_by_label: Percentage of the region covered by the label.
Ref_region_perc: Percentage of the label region within the target region.
modal_atlas_index: Index number of label region in reference atlas
all_regions_covered: All regions covered >5% in descending order of importance

For example, if a region is labeled 'TE1a' and Perc_covered_by_label = 8, Ref_region_perc = 38, and Atlas_regions_covered = 17, this means
that 8% of the region's voxels are labeled TE1a, which is the highest percentage among reference label regions. 38% of the region TE1a is
covered by the region. However, the region covers at least 25% of 17 distinct labeled reference regions.

References for atlases:

Beliveau, Vincent, Claus Svarer, Vibe G. Frokjaer, Gitte M. Knudsen, Douglas N. Greve, and Patrick M. Fisher. 2015. “Functional
Connectivity of the Dorsal and Median Raphe Nuclei at Rest.” NeuroImage 116 (August): 187–95.
Bär, Karl-Jürgen, Feliberto de la Cruz, Andy Schumann, Stefanie Koehler, Heinrich Sauer, Hugo Critchley, and Gerd Wagner. 2016. ?Functional
Connectivity and Network Analysis of Midbrain and Brainstem Nuclei.? NeuroImage 134 (July):53?63.
Diedrichsen, Jörn, Joshua H. Balsters, Jonathan Flavell, Emma Cussans, and Narender Ramnani. 2009. A Probabilistic MR Atlas of the Human
Cerebellum. NeuroImage 46 (1): 39?46.
Fairhurst, Merle, Katja Wiech, Paul Dunckley, and Irene Tracey. 2007. ?Anticipatory Brainstem Activity Predicts Neural Processing of Pain
in Humans.? Pain 128 (1-2):101?10.
Fan 2016 Cerebral Cortex; doi:10.1093/cercor/bhw157
Glasser, Matthew F., Timothy S. Coalson, Emma C. Robinson, Carl D. Hacker, John Harwell, Essa Yacoub, Kamil Ugurbil, et al. 2016. A
Multi-Modal Parcellation of Human Cerebral Cortex. Nature 536 (7615): 171?78.
Keren, Noam I., Carl T. Lozar, Kelly C. Harris, Paul S. Morgan, and Mark A. Eckert. 2009. “In Vivo Mapping of the Human Locus Coeruleus.”
NeuroImage 47 (4): 1261–67.
Keuken, M. C., P-L Bazin, L. Crown, J. Hootsmans, A. Laufer, C. Müller-Axt, R. Sier, et al. 2014. “Quantifying Inter-Individual Anatomical
Variability in the Subcortex Using 7 T Structural MRI.” NeuroImage 94 (July): 40–46.
Krauth A, Blanc R, Poveda A, Jeanmonod D, Morel A, Székely G. (2010) A mean three-dimensional atlas of the human thalamus: generation from
multiple histological data. Neuroimage. 2010 Feb 1;49(3):2053-62. Jakab A, Blanc R, Berényi EL, Székely G. (2012) Generation of
Individualized Thalamus Target Maps by Using Statistical Shape Models and Thalamocortical Tractography. AJNR Am J Neuroradiol. 33:
2110-2116, doi: 10.3174/ajnr.A3140
Nash, Paul G., Vaughan G. Macefield, Iven J. Klineberg, Greg M. Murray, and Luke A. Henderson. 2009. ?Differential Activation of the Human
Trigeminal Nuclear Complex by Noxious and Non-Noxious Orofacial Stimulation.? Human Brain Mapping 30 (11):3772?82.
Pauli 2018 Bioarxiv: CIT168 from Human Connectome Project data
Pauli, Wolfgang M., Amanda N. Nili, and J. Michael Tyszka. 2018. ?A High-Resolution Probabilistic in Vivo Atlas of Human Subcortical Brain
Nuclei.? Scientific Data 5 (April): 180063.
Pauli, Wolfgang M., Randall C. O?Reilly, Tal Yarkoni, and Tor D. Wager. 2016. ?Regional Specialization within the Human Striatum for
Diverse Psychological Functions.? Proceedings of the National Academy of Sciences of the United States of America 113 (7): 1907?12.
Sclocco, Roberta, Florian Beissner, Gaelle Desbordes, Jonathan R. Polimeni, Lawrence L. Wald, Norman W. Kettner, Jieun Kim, et al. 2016.
?Neuroimaging Brainstem Circuitry Supporting Cardiovagal Response to Pain: A Combined Heart Rate Variability/ultrahigh-Field (7 T)
Functional Magnetic Resonance Imaging Study.? Philosophical Transactions. Series A, Mathematical, Physical, and Engineering Sciences 374
(2067). rsta.royalsocietypublishing.org. https://doi.org/10.1098/rsta.2015.0189.
Shen, X., F. Tokoglu, X. Papademetris, and R. T. Constable. 2013. “Groupwise Whole-Brain Parcellation from Resting-State fMRI Data for
Network Node Identification.” NeuroImage 82 (November): 403–15.
Zambreanu, L., R. G. Wise, J. C. W. Brooks, G. D. Iannetti, and I. Tracey. 2005. ?A Role for the Brainstem in Central Sensitisation in
Humans. Evidence from Functional Magnetic Resonance Imaging.? Pain 114 (3):397?407.

Note: Region object r(i).title contains full list of reference atlas regions covered by each cluster.
____________________________________________________________________________________________________________________________________________
Path ab results table, uncorrected
----------------------------------------------
Path ab, Uncorrected (p < .01)
----------------------------------------------

Image   1
  1 contig. clusters, sizes   4 to   4
Positive effect:   4 voxels, min p-value: 0.00332451
Negative effect:   0 voxels, min p-value: 0.00947906
> Found image data, extracting region averages.
Spaces for data object and mask object line up, but voxel numbers do not. Check.
> Resampling to mask space first.
fmri_data.extract_roi_averages: Defining mask object.
Grouping contiguous voxels:   1 regions
Averaging data. Done.

____________________________________________________________________________________________________________________________________________
Positive Effects
      Region       Volume           XYZ           maxZ     modal_label_descriptions    Perc_covered_by_label    Atlas_regions_covered    region_index
    ___________    ______    _________________    _____    ________________________    _____________________    _____________________    ____________

    'Ctx_8BL_L'     1376     -14     45     45    2.936     'Cortex_Default_ModeB'              35                        0                   1


Negative Effects
No regions to display

____________________________________________________________________________________________________________________________________________
Regions labeled by reference atlas CANlab_2018_combined

Volume: Volume of contiguous region in cubic mm.
MaxZ: Signed max over Z-score for each voxel.
Atlas_regions_covered: Number of reference atlas regions covered at least 25% by the region. This relates to whether the region covers
multiple reference atlas regions
Region: Best reference atlas label, defined as reference region with highest number of in-region voxels. Regions covering >25% of >5
regions labeled as "Multiple regions"
Perc_covered_by_label: Percentage of the region covered by the label.
Ref_region_perc: Percentage of the label region within the target region.
modal_atlas_index: Index number of label region in reference atlas
all_regions_covered: All regions covered >5% in descending order of importance

For example, if a region is labeled 'TE1a' and Perc_covered_by_label = 8, Ref_region_perc = 38, and Atlas_regions_covered = 17, this means
that 8% of the region's voxels are labeled TE1a, which is the highest percentage among reference label regions. 38% of the region TE1a is
covered by the region. However, the region covers at least 25% of 17 distinct labeled reference regions.

References for atlases:

Beliveau, Vincent, Claus Svarer, Vibe G. Frokjaer, Gitte M. Knudsen, Douglas N. Greve, and Patrick M. Fisher. 2015. “Functional
Connectivity of the Dorsal and Median Raphe Nuclei at Rest.” NeuroImage 116 (August): 187–95.
Bär, Karl-Jürgen, Feliberto de la Cruz, Andy Schumann, Stefanie Koehler, Heinrich Sauer, Hugo Critchley, and Gerd Wagner. 2016. ?Functional
Connectivity and Network Analysis of Midbrain and Brainstem Nuclei.? NeuroImage 134 (July):53?63.
Diedrichsen, Jörn, Joshua H. Balsters, Jonathan Flavell, Emma Cussans, and Narender Ramnani. 2009. A Probabilistic MR Atlas of the Human
Cerebellum. NeuroImage 46 (1): 39?46.
Fairhurst, Merle, Katja Wiech, Paul Dunckley, and Irene Tracey. 2007. ?Anticipatory Brainstem Activity Predicts Neural Processing of Pain
in Humans.? Pain 128 (1-2):101?10.
Fan 2016 Cerebral Cortex; doi:10.1093/cercor/bhw157
Glasser, Matthew F., Timothy S. Coalson, Emma C. Robinson, Carl D. Hacker, John Harwell, Essa Yacoub, Kamil Ugurbil, et al. 2016. A
Multi-Modal Parcellation of Human Cerebral Cortex. Nature 536 (7615): 171?78.
Keren, Noam I., Carl T. Lozar, Kelly C. Harris, Paul S. Morgan, and Mark A. Eckert. 2009. “In Vivo Mapping of the Human Locus Coeruleus.”
NeuroImage 47 (4): 1261–67.
Keuken, M. C., P-L Bazin, L. Crown, J. Hootsmans, A. Laufer, C. Müller-Axt, R. Sier, et al. 2014. “Quantifying Inter-Individual Anatomical
Variability in the Subcortex Using 7 T Structural MRI.” NeuroImage 94 (July): 40–46.
Krauth A, Blanc R, Poveda A, Jeanmonod D, Morel A, Székely G. (2010) A mean three-dimensional atlas of the human thalamus: generation from
multiple histological data. Neuroimage. 2010 Feb 1;49(3):2053-62. Jakab A, Blanc R, Berényi EL, Székely G. (2012) Generation of
Individualized Thalamus Target Maps by Using Statistical Shape Models and Thalamocortical Tractography. AJNR Am J Neuroradiol. 33:
2110-2116, doi: 10.3174/ajnr.A3140
Nash, Paul G., Vaughan G. Macefield, Iven J. Klineberg, Greg M. Murray, and Luke A. Henderson. 2009. ?Differential Activation of the Human
Trigeminal Nuclear Complex by Noxious and Non-Noxious Orofacial Stimulation.? Human Brain Mapping 30 (11):3772?82.
Pauli 2018 Bioarxiv: CIT168 from Human Connectome Project data
Pauli, Wolfgang M., Amanda N. Nili, and J. Michael Tyszka. 2018. ?A High-Resolution Probabilistic in Vivo Atlas of Human Subcortical Brain
Nuclei.? Scientific Data 5 (April): 180063.
Pauli, Wolfgang M., Randall C. O?Reilly, Tal Yarkoni, and Tor D. Wager. 2016. ?Regional Specialization within the Human Striatum for
Diverse Psychological Functions.? Proceedings of the National Academy of Sciences of the United States of America 113 (7): 1907?12.
Sclocco, Roberta, Florian Beissner, Gaelle Desbordes, Jonathan R. Polimeni, Lawrence L. Wald, Norman W. Kettner, Jieun Kim, et al. 2016.
?Neuroimaging Brainstem Circuitry Supporting Cardiovagal Response to Pain: A Combined Heart Rate Variability/ultrahigh-Field (7 T)
Functional Magnetic Resonance Imaging Study.? Philosophical Transactions. Series A, Mathematical, Physical, and Engineering Sciences 374
(2067). rsta.royalsocietypublishing.org. https://doi.org/10.1098/rsta.2015.0189.
Shen, X., F. Tokoglu, X. Papademetris, and R. T. Constable. 2013. “Groupwise Whole-Brain Parcellation from Resting-State fMRI Data for
Network Node Identification.” NeuroImage 82 (November): 403–15.
Zambreanu, L., R. G. Wise, J. C. W. Brooks, G. D. Iannetti, and I. Tracey. 2005. ?A Role for the Brainstem in Central Sensitisation in
Humans. Evidence from Functional Magnetic Resonance Imaging.? Pain 114 (3):397?407.

Note: Region object r(i).title contains full list of reference atlas regions covered by each cluster.
____________________________________________________________________________________________________________________________________________
Montage plot with slices, uncorrected
Grouping contiguous voxels:   9 regions
sagittal montage: 1073 voxels displayed, 16779 not displayed on these slices
axial montage: 8813 voxels displayed, 9039 not displayed on these slices
Grouping contiguous voxels:  22 regions
sagittal montage:  37 voxels displayed, 338 not displayed on these slices
axial montage: 146 voxels displayed, 229 not displayed on these slices
Grouping contiguous voxels:   1 regions
sagittal montage:   0 voxels displayed,   4 not displayed on these slices
axial montage:   1 voxels displayed,   3 not displayed on these slices

Savefile information for objects with extracted data
----------------------------------------------
Saving extracted objects to disk.
----------------------------------------------
a_obj, b_obj, ab_obj : statistic_image objects for paths a, b, ab
a_regions_fdr, etc.  : region objects for paths a, b, ab at FDR threshold
a_regions_unc, etc.  : region objects for paths a, b, ab at uncorrected threshold
In region objects, region_obj(i).dat contains extracted data for the i-th significant region, averaged over voxels
Use these data in plots, secondary analyses, or to re-run mediation.m within individual regions
Saved objects in:
/Users/torwager/Downloads/Test_mediation/Test_mediation/Test_mediation/clusters_with_extracted_data/Statistic_image_and_region_objects.mat