Contents
Dependencies:
test_dat = load_image_set('emotionreg', 'noverbose');
image_obj = mean(test_dat);
Run neurosynth similarity
[image_by_feature_correlations, top_feature_tables] = neurosynth_feature_labels( image_obj, 'images_are_replicates', false, 'noverbose');
Input image 1
fullpath_was_empty
_____________________________________________________________________
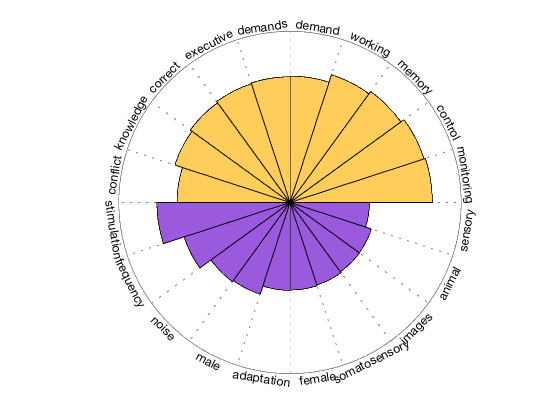
    testr_low       words_low       testr_high     words_high
    _________    _______________    __________    ____________

    -0.23326     'stimulation'        0.2495      'monitoring'
    -0.19523     'frequency'         0.24703      'control'
    -0.17128     'noise'             0.24036      'memory'
    -0.16888     'male'              0.23539      'working'
    -0.15396     'adaptation'        0.22153      'demand'
    -0.15345     'female'            0.22031      'demands'
    -0.15209     'somatosensory'     0.21877      'executive'
    -0.15023     'images'            0.21601      'correct'
    -0.14991     'animal'            0.21213      'knowledge'
    -0.13918     'sensory'           0.19795      'conflict'
Aggregate results for plot
lowwords = [top_feature_tables{1}.words_low(:)]';
disp(lowwords)

highwords = [top_feature_tables{1}.words_high(:)]';
disp(highwords)

r_low = top_feature_tables{1}.testr_low;
r_high = top_feature_tables{1}.testr_high;

r_to_plot = [r_high; r_low];
textlabels = [ highwords lowwords];
  Columns 1 through 5

    'stimulation'    'frequency'    'noise'    'male'    'adaptation'

  Columns 6 through 10

    'female'    'somatosensory'    'images'    'animal'    'sensory'

  Columns 1 through 6

    'monitoring'    'control'    'memory'    'working'    'demand'    'demands'

  Columns 7 through 10

    'executive'    'correct'    'knowledge'    'conflict'
create_figure('wedge_plot');
hh = tor_wedge_plot(r_to_plot, textlabels, 'outer_circle_radius', .3, 'colors', {[1 .7 0] [.4 0 .8]}, 'bicolor', 'nofigure');

