How Do I Visualize Data
The help file shows you how to display neuroimaging data for publication by marianne reddan, 2016
Contents
Dependencies:
% Matlab statistics toolbox
	% Matlab signal processing toolbox
	% Statistical Parametric Mapping (SPM) software https://www.fil.ion.ucl.ac.uk/spm/
	% For full functionality, the full suite of CANlab toolboxes is recommended. See here: Installing Tools
General instructions
-----------------------------------------------------------------------
Before you start, the CANlab_Core_Tools must be added to your path with subfolders. Otherwise, you will get errors.
This example will use the neurologic pain signature (NPS): "weights_NSF_grouppred_cvpcr" %NOTE TO TOR: This is currently in masks private
These data were published in: Wager, T. D., Atlas, L. Y., Lindquist, M. A., Roy, M., Woo, C.W., & Kross, E. (2013). An fMRI-Based Neurologic Signature of Physical Pain. New England Journal of Medicine, 368:1388-97.
% ----------------------------------------------
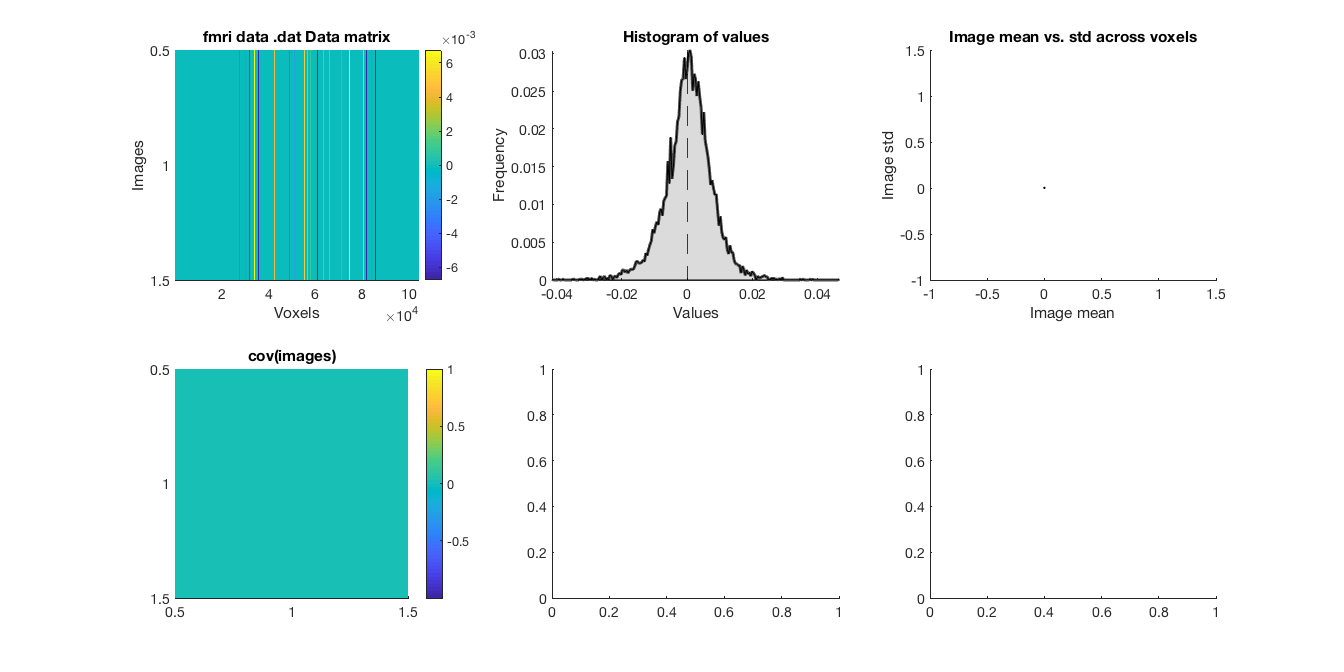
Section 1: Load in data and quick view
---------------------------------------------- Load in the image (any .nii or img) as an fmri_data object
nps = fmri_data(which('weights_NSF_grouppred_cvpcr.img'));

% Quickly dispaly it and eyeball its properties
figure; plot(nps)
snapnow

close all;
% ----------------------------------------------
Using default mask: /Users/torwager/Documents/GitHub/CanlabCore/CanlabCore/canlab_canonical_brains/Canonical_brains_surfaces/brainmask.nii
loading mask. mapping volumes.
checking that dimensions and voxel sizes of volumes are the same.
Pre-allocating data array. Needed: 417440 bytes
Loading image number:     1
Elapsed time is 0.013464 seconds.
Image names entered, but fullpath attribute is empty. Getting path info.

SPM12: spm_check_registration (v6245)              19:34:20 - 02/08/2018
========================================================================
Display <a href="matlab:spm_image('display','/Users/torwager/Documents/GitHub/CanlabCore/CanlabCore/canlab_canonical_brains/Canonical_brains_surfaces/keuken_2014_enhanced_for_underlay.img,1');">/Users/torwager/Documents/GitHub/CanlabCore/CanlabCore/canlab_canonical_brains/Canonical_brains_surfaces/keuken_2014_enhanced_for_underlay.img,1</a>

ans =

     []

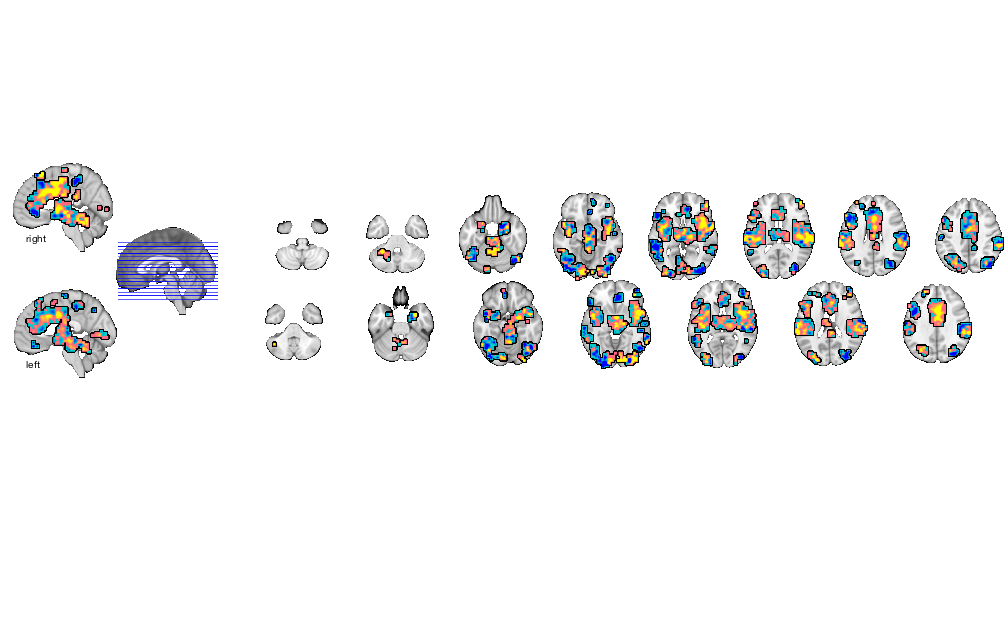
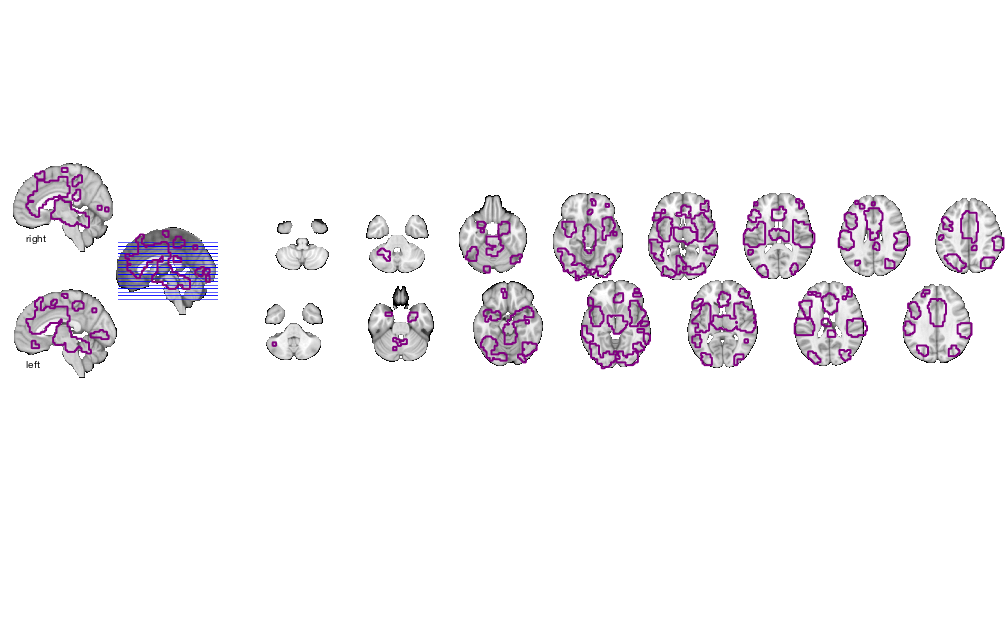
Plot slices with canlab_results_fmridisplay
---------------------------------------------- You must convert the fmri_data object to a region object This takes a lot of memory, and can hang if you have too little.
figure; o2 = canlab_results_fmridisplay(region(nps),'noverbose');
snapnow

% Alternatively, display the slices you want first, then add image data
% This function has advanced control like outlining blobs, transparency
% overlays
figure; o2 = canlab_results_fmridisplay([],'noverbose');
o2=addblobs(o2,region(nps),'color',[.5 0 .5],'outline','linewidth', 2,'transvalue', .75)
snapnow

% Change the slices with 'montagetype' function
figure; o2 = canlab_results_fmridisplay(region(nps),'montagetype','compact2','noverbose');
snapnow
close all;
% ----------------------------------------------
Grouping contiguous voxels:  57 regions
sagittal montage: 334 voxels displayed, 9526 not displayed on these slices
sagittal montage: 367 voxels displayed, 9493 not displayed on these slices
axial montage: 2231 voxels displayed, 7629 not displayed on these slices
axial montage: 2397 voxels displayed, 7463 not displayed on these slices
sagittal montage: 334 voxels displayed, 9526 not displayed on these slices
sagittal montage: 367 voxels displayed, 9493 not displayed on these slices
axial montage: 2231 voxels displayed, 7629 not displayed on these slices
axial montage: 2397 voxels displayed, 7463 not displayed on these slices
Grouping contiguous voxels:  57 regions
sagittal montage: 334 voxels displayed, 9526 not displayed on these slices
WARNING: CONTOUR PLOTS DO NOT SEEM TO HAVE ADJUSTABLE TRANSPARENCY IN R2014B+ MATLAB
sagittal montage: 367 voxels displayed, 9493 not displayed on these slices
WARNING: CONTOUR PLOTS DO NOT SEEM TO HAVE ADJUSTABLE TRANSPARENCY IN R2014B+ MATLAB
sagittal montage: 360 voxels displayed, 9500 not displayed on these slices
WARNING: CONTOUR PLOTS DO NOT SEEM TO HAVE ADJUSTABLE TRANSPARENCY IN R2014B+ MATLAB
axial montage: 2231 voxels displayed, 7629 not displayed on these slices
WARNING: CONTOUR PLOTS DO NOT SEEM TO HAVE ADJUSTABLE TRANSPARENCY IN R2014B+ MATLAB
WARNING: CONTOUR PLOTS DO NOT SEEM TO HAVE ADJUSTABLE TRANSPARENCY IN R2014B+ MATLAB
WARNING: CONTOUR PLOTS DO NOT SEEM TO HAVE ADJUSTABLE TRANSPARENCY IN R2014B+ MATLAB
WARNING: CONTOUR PLOTS DO NOT SEEM TO HAVE ADJUSTABLE TRANSPARENCY IN R2014B+ MATLAB
WARNING: CONTOUR PLOTS DO NOT SEEM TO HAVE ADJUSTABLE TRANSPARENCY IN R2014B+ MATLAB
WARNING: CONTOUR PLOTS DO NOT SEEM TO HAVE ADJUSTABLE TRANSPARENCY IN R2014B+ MATLAB
WARNING: CONTOUR PLOTS DO NOT SEEM TO HAVE ADJUSTABLE TRANSPARENCY IN R2014B+ MATLAB
WARNING: CONTOUR PLOTS DO NOT SEEM TO HAVE ADJUSTABLE TRANSPARENCY IN R2014B+ MATLAB
axial montage: 2397 voxels displayed, 7463 not displayed on these slices
WARNING: CONTOUR PLOTS DO NOT SEEM TO HAVE ADJUSTABLE TRANSPARENCY IN R2014B+ MATLAB
WARNING: CONTOUR PLOTS DO NOT SEEM TO HAVE ADJUSTABLE TRANSPARENCY IN R2014B+ MATLAB
WARNING: CONTOUR PLOTS DO NOT SEEM TO HAVE ADJUSTABLE TRANSPARENCY IN R2014B+ MATLAB
WARNING: CONTOUR PLOTS DO NOT SEEM TO HAVE ADJUSTABLE TRANSPARENCY IN R2014B+ MATLAB
WARNING: CONTOUR PLOTS DO NOT SEEM TO HAVE ADJUSTABLE TRANSPARENCY IN R2014B+ MATLAB
WARNING: CONTOUR PLOTS DO NOT SEEM TO HAVE ADJUSTABLE TRANSPARENCY IN R2014B+ MATLAB
WARNING: CONTOUR PLOTS DO NOT SEEM TO HAVE ADJUSTABLE TRANSPARENCY IN R2014B+ MATLAB
WARNING: CONTOUR PLOTS DO NOT SEEM TO HAVE ADJUSTABLE TRANSPARENCY IN R2014B+ MATLAB

o2 =

  fmridisplay with properties:

            overlay: '/Users/torwager/Documents/GitHub/CanlabCore/CanlabCore/canlab_canonical_brains/Canonical_brains_surfaces/keuken_2014_enhanced_for_underlay.img'
              SPACE: [1×1 struct]
    activation_maps: {[1×1 struct]}
            montage: {1×5 cell}
            surface: {}
          orthviews: {}
            history: {}
    history_descrip: []
    additional_info: ''
Grouping contiguous voxels:  57 regions
Warning: Unknown input string option:montagetype
axial montage: 3527 voxels displayed, 6333 not displayed on these slices
Warning: Unknown input string option:montagetype
sagittal montage: 701 voxels displayed, 9159 not displayed on these slices
axial montage: 3527 voxels displayed, 6333 not displayed on these slices
sagittal montage: 701 voxels displayed, 9159 not displayed on these slices

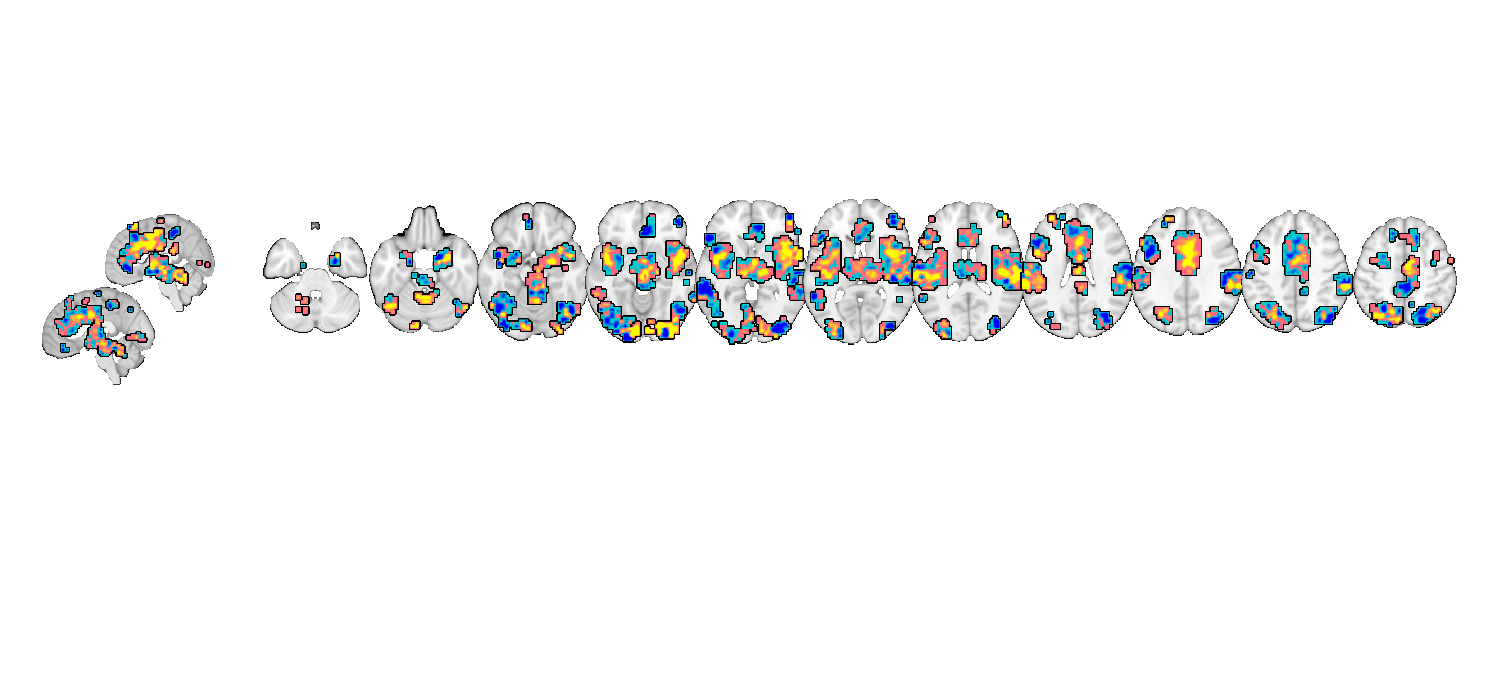
For greater control over the slices displayed, use montage
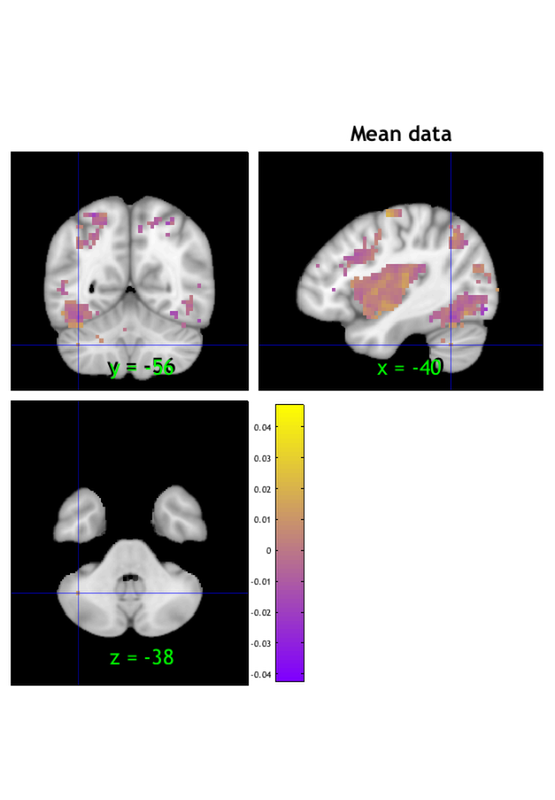
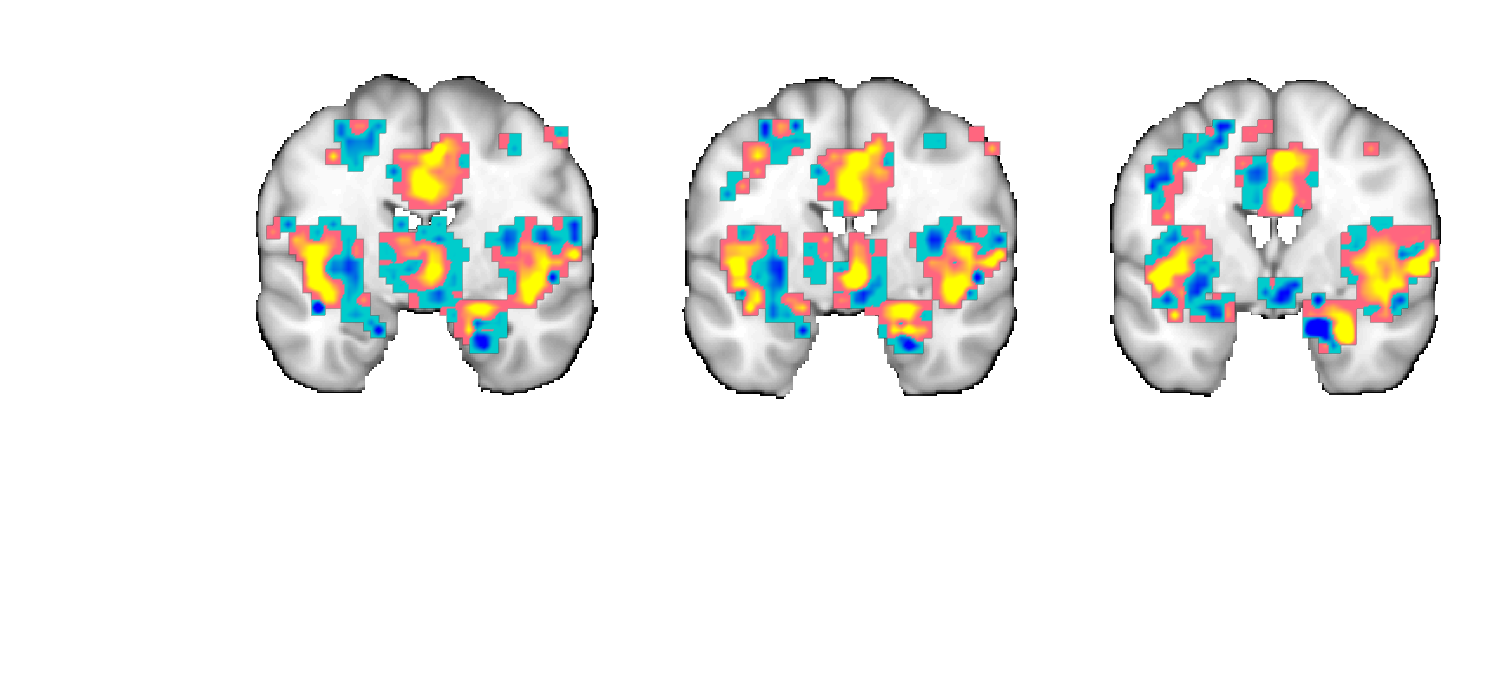
---------------------------------------------- 'slice_range' allows you to select the x y z coordinates give it a range of values, and determine the 'spacing' between them
figure;o2 = fmridisplay;
o2 = montage(o2, 'axial', 'slice_range', [-10 10], 'onerow', 'spacing', 5);
o2 = montage(o2, 'coronal', 'slice_range', [-6 0], 'onerow','spacing', 3);
o2 = montage(o2, 'saggital', 'slice_range', [-10 10], 'spacing', 5);
o2=addblobs(o2,region(nps));
snapnow
close all

% ----------------------------------------------
Load underlay. Define axes. Ready.
Load underlay. Define axes. Ready.
Load underlay. Define axes. Ready.
Grouping contiguous voxels:  57 regions
axial montage: 2318 voxels displayed, 7542 not displayed on these slices
coronal montage: 1032 voxels displayed, 8828 not displayed on these slices
sagittal montage: 1726 voxels displayed, 8134 not displayed on these slices

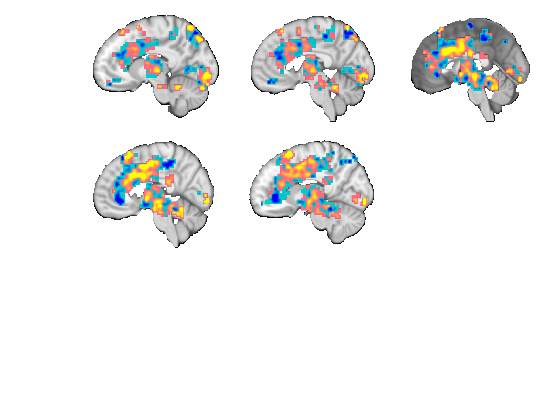
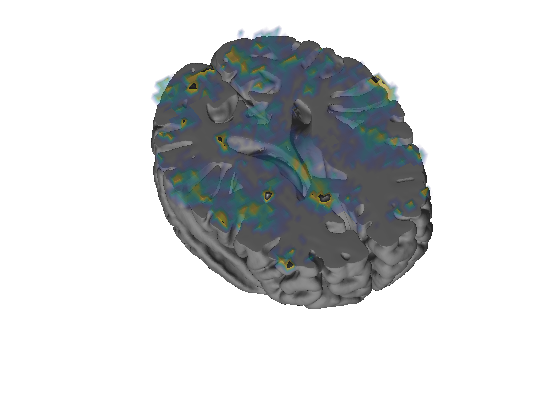
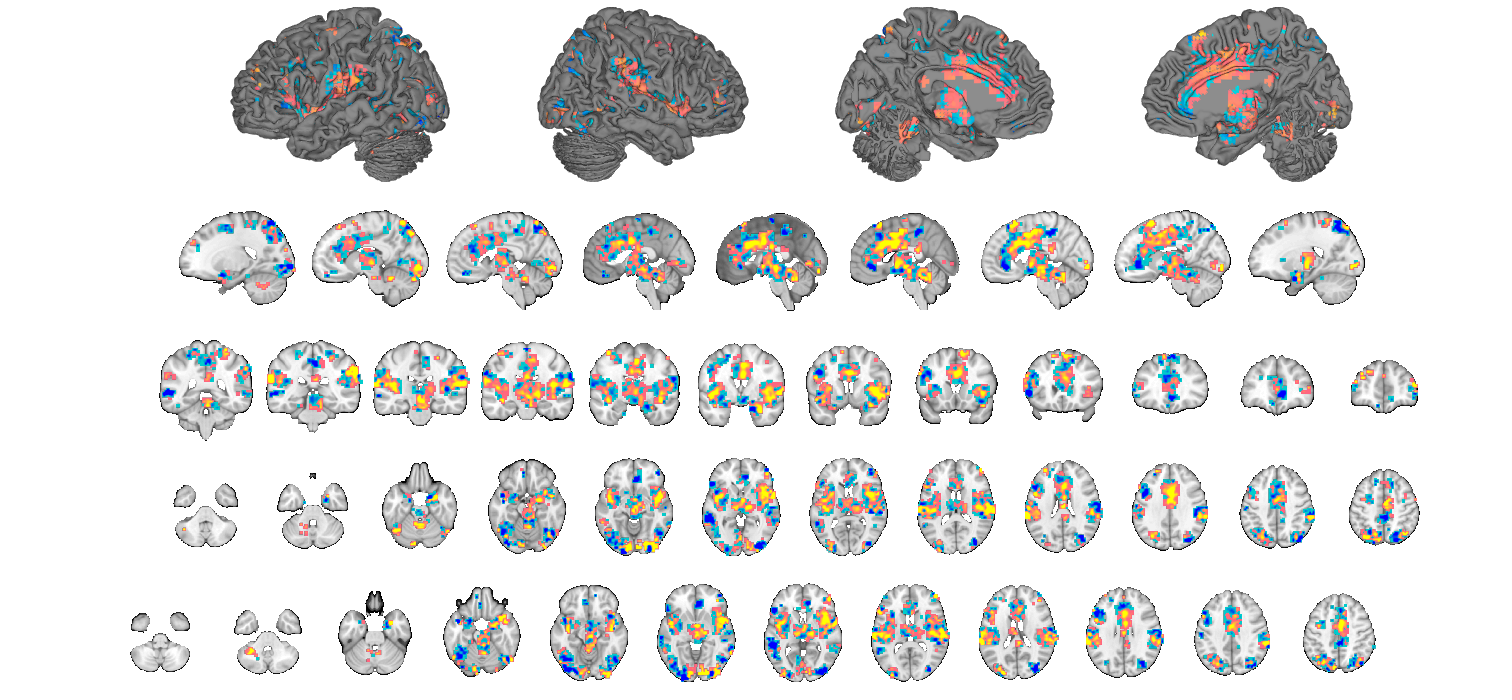
For 3D Surface Plots
---------------------------------------------- There are multple options for producing 3D brains.
% See fmri_data.isosurface

% --------
% OPT1 - Plot on a 'slab' of brain like Reddan, Lindquist, Wager (2016)
% Effect Size paper
% --------
% First set up your underlay brain image (anatomical)
ovlname = 'keuken_2014_enhanced_for_underlay'; %this image is in CanlabCore
ycut_mm = -30; % Where to cut brain on Y axis
coords = [0 ycut_mm 0];
coords = [0 0 20];
anat = fmri_data(which('keuken_2014_enhanced_for_underlay.img'));
% Next set up the surface plot of your data
figure;
set(gcf, 'Tag', 'surface');
f1 = gcf;
p = isosurface(anat, 'thresh', 140, 'nosmooth', 'zlim', [-Inf 20]);
view(137, 26);
lightRestoreSingle
colormap gray;
brighten(.6);
set(p, 'FaceAlpha', 1);
drawnow
set(f1, 'Color', 'w');
[mip, x, y, voldata] = pattern_surf_plot_mip(nps, 'nosmooth');
figure(f1)
hold on;
% Next rescale your surface data to match anatomical brainmap we want (kludge)
han = surf(x, y, mip .* 70 + 20);
set(han, 'AlphaDataMapping', 'scaled', 'AlphaData', abs(mip) .^ .5, 'FaceColor', 'interp', 'FaceAlpha', 'interp', 'EdgeColor', 'interp');
set(han, 'EdgeColor', 'none');
% Set colormap for plot
def = colormap('parula');
gray = colormap('gray');
cm = [def; gray];
colormap(cm);
view(147, 50);
axis off
% Apply to brain
drawnow; snapnow
close all;

% ---------
% OPT2 - Use default surf plot option in canlab_results_fmridisplay_marianne
% --------
o2 = canlab_results_fmridisplay(region(nps),'full','noverbose', 'nooutline');
snapnow;

% --------
% OPT3 - function tor_3D, or export your data to Caret
% --------

% ----------------------------------------------
Using default mask: /Users/torwager/Documents/GitHub/CanlabCore/CanlabCore/canlab_canonical_brains/Canonical_brains_surfaces/brainmask.nii
loading mask. mapping volumes.
checking that dimensions and voxel sizes of volumes are the same.
Pre-allocating data array. Needed: 32864076 bytes
Loading image number:     1
Elapsed time is 0.379625 seconds.
Image names entered, but fullpath attribute is empty. Getting path info.
Returning coordinates in mm and meshgrid matrices.

ans =

  Light with properties:

       Color: [1 1 1]
       Style: 'infinite'
    Position: [0.8669 0.9296 0.6200]
     Visible: 'on'

  Use GET to show all properties
Grouping contiguous voxels:  57 regions
    48

Warning: Unknown input string option:wh_surfaces
sagittal montage: 2720 voxels displayed, 7140 not displayed on these slices
Warning: Unknown input string option:wh_surfaces
coronal montage: 2681 voxels displayed, 7179 not displayed on these slices
Warning: Unknown input string option:wh_surfaces
axial montage: 3528 voxels displayed, 6332 not displayed on these slices
Warning: Unknown input string option:wh_surfaces
axial montage: 3425 voxels displayed, 6435 not displayed on these slices
Using custom color maps.
Found surface patch handles - plotting on existing surfaces.
cluster_surf
___________________________________________
	  1 cluster structures entered
  Colors are:
 1  0  0
 Building XYZ coord list

ans =

  single

  275.5039

 Getting heat-mapped colors
 Building color change function call
 Using existing surface image
 Running color change.
 eval: [c,alld] = getVertexColors(xyz{1},p,mycolors{1},[.5 .5 .5],2,'ovlcolor',[0 1 1],'colorscale',actcolors{1});
Main color vertices: 221348 vertices.  selecting: 201076
9860 coords.  selecting: 6151
Running   7 sets of coordinates: 007Finished!
___________________________________________
Using custom color maps.
Found surface patch handles - plotting on existing surfaces.
cluster_surf
___________________________________________
	  1 cluster structures entered
  Colors are:
 1  0  0
 Building XYZ coord list

ans =

  single

  275.5039

 Getting heat-mapped colors
 Building color change function call
 Using existing surface image
 Running color change.
 eval: [c,alld] = getVertexColors(xyz{1},p,mycolors{1},[.5 .5 .5],2,'ovlcolor',[0 1 1],'colorscale',actcolors{1});
Main color vertices: 225350 vertices.  selecting: 197050
9860 coords.  selecting: 4874
Running   5 sets of coordinates: 005Finished!
___________________________________________
Using custom color maps.
Found surface patch handles - plotting on existing surfaces.
cluster_surf
___________________________________________
	  1 cluster structures entered
  Colors are:
 1  0  0
 Building XYZ coord list

ans =

  single

  275.5039

 Getting heat-mapped colors
 Building color change function call
 Using existing surface image
 Running color change.
 eval: [c,alld] = getVertexColors(xyz{1},p,mycolors{1},[.5 .5 .5],2,'ovlcolor',[0 1 1],'colorscale',actcolors{1});
Main color vertices: 221348 vertices.  selecting: 201076
9860 coords.  selecting: 6151
Running   7 sets of coordinates: 007Finished!
___________________________________________
Using custom color maps.
Found surface patch handles - plotting on existing surfaces.
cluster_surf
___________________________________________
	  1 cluster structures entered
  Colors are:
 1  0  0
 Building XYZ coord list

ans =

  single

  275.5039

 Getting heat-mapped colors
 Building color change function call
 Using existing surface image
 Running color change.
 eval: [c,alld] = getVertexColors(xyz{1},p,mycolors{1},[.5 .5 .5],2,'ovlcolor',[0 1 1],'colorscale',actcolors{1});
Main color vertices: 225350 vertices.  selecting: 197050
9860 coords.  selecting: 4874
Running   5 sets of coordinates: 005Finished!
___________________________________________
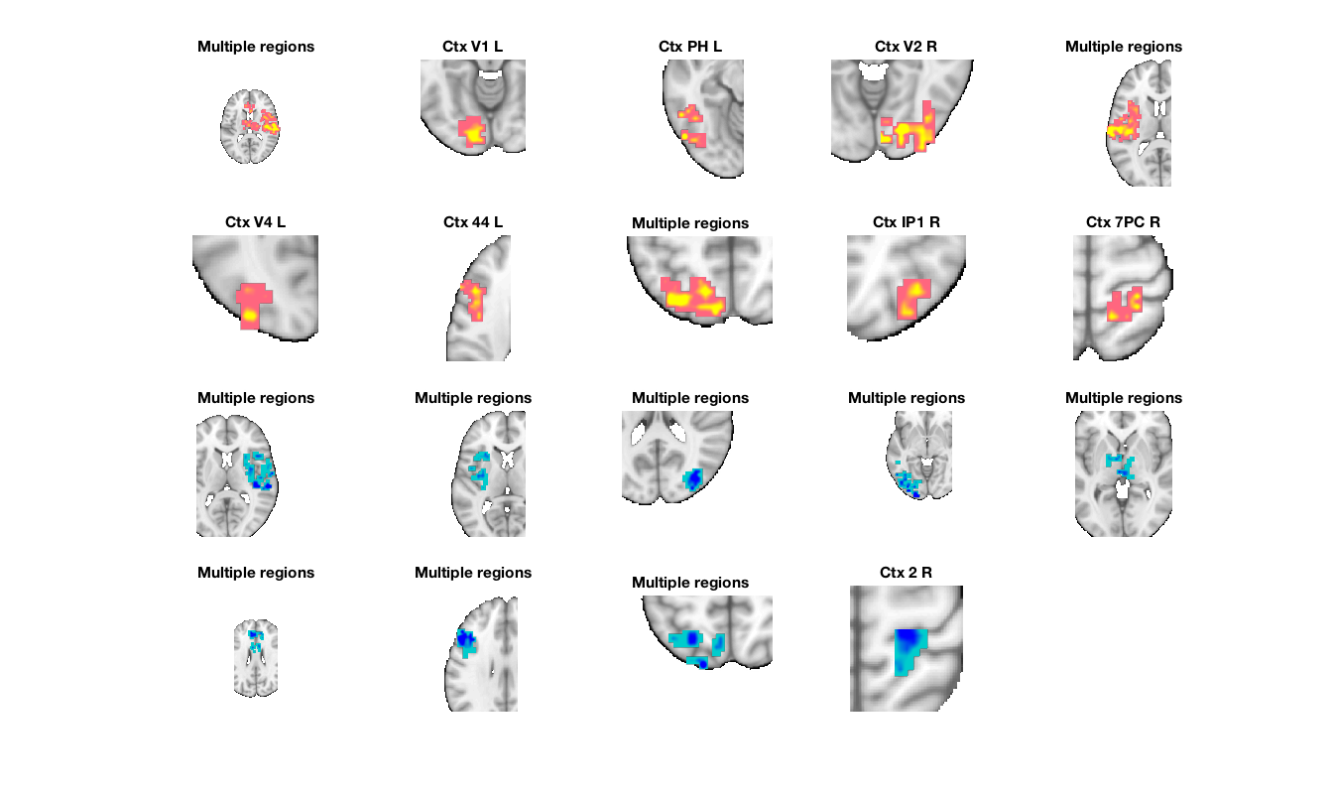
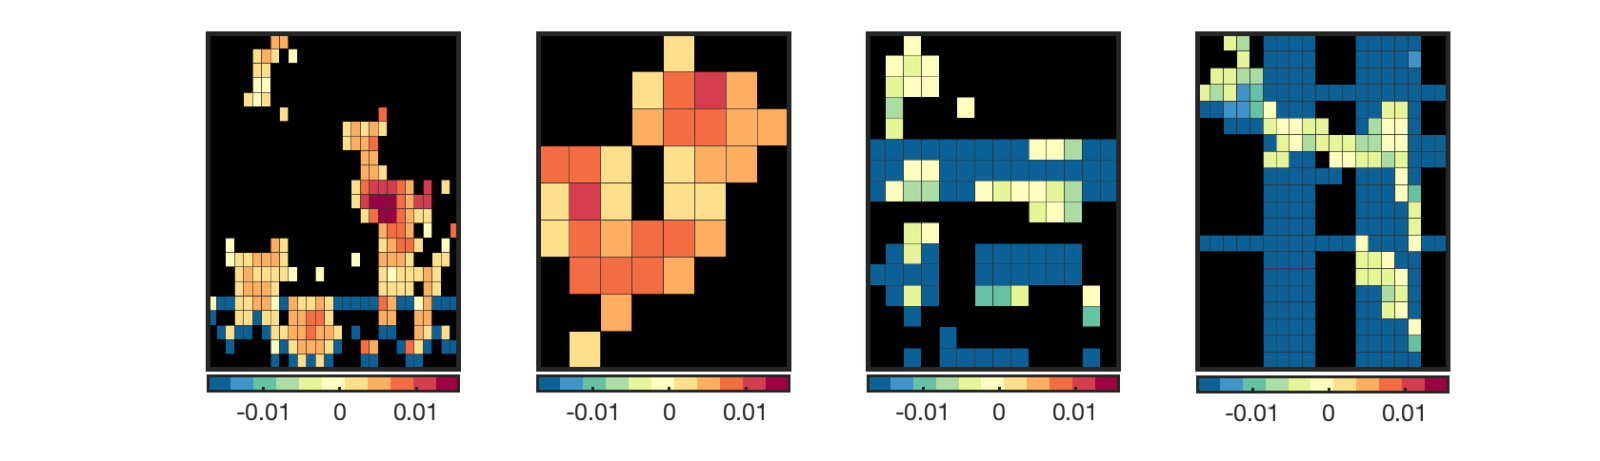
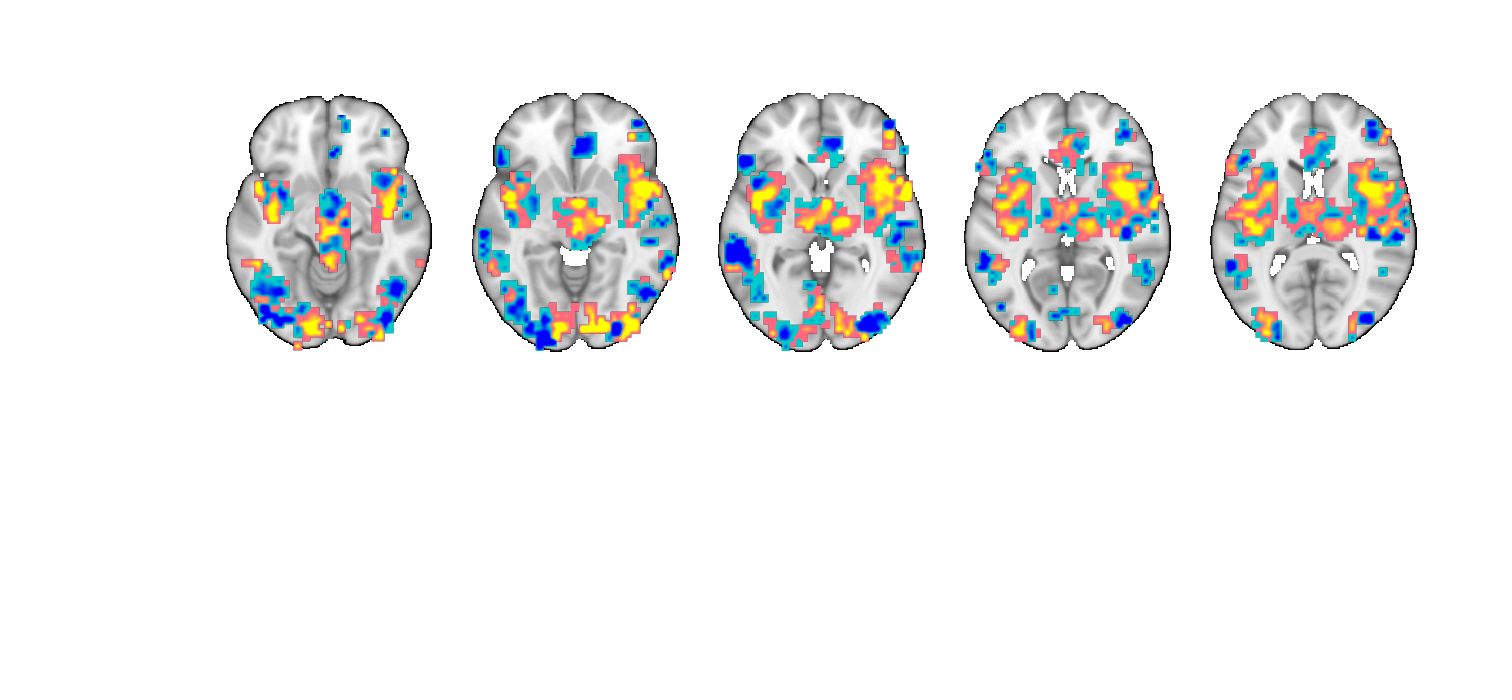
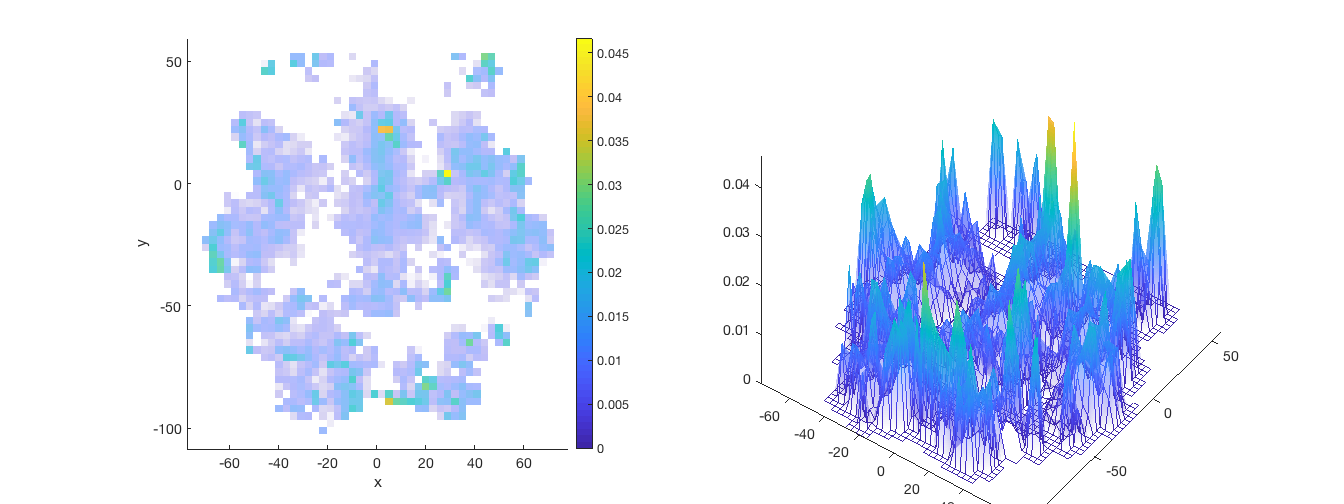
For plotting voxel plots of ROIs use roi_contour_map
---------------------------------------------- Convert image into clusters with region() Determine which clusters you want to plot and select them within the cluster object e.g., cl(NUMBEROFCLUSTER(S))
cl = region(nps);

% threshold based on extent of 8 vox or greater
num_vox_per_cluster = cat(1, cl.numVox);
cl(num_vox_per_cluster < 8) = [];

% Print a table, and return clusters with names attached in the cl structure
% This will separate positive and negative-valued voxels in each region

[clpos, clneg] = table(cl);
new_cl_with_labels = [clpos clneg];

% threshold based on extent of 50 vox or greater - just to have a set to
% display nicely:
num_vox_per_cluster = cat(1, new_cl_with_labels.numVox);
new_cl_with_labels(num_vox_per_cluster < 50) = [];


% Montage of the clusters, showing each
montage(new_cl_with_labels, 'colormap', 'regioncenters');
snapnow

% Now plot
info = roi_contour_map(new_cl_with_labels(1:5:end), 'cluster', 'use_same_range', 'colorbar');
snapnow

% Note if you get errors here, check the number of voxels in your cluster.
% If less than 2, you cannot use this function.
% Here is an example of how to check
% for i=1:length(cl);disp(sprintf('cluster %d is %d voxels',i,cl(i).numVox));end
Grouping contiguous voxels: 57 regions
____________________________________________________________________________________________________________________________________________
Positive Effects
Region Volume XYZ maxZ modal_label_descriptions Perc_covered_by_label Atlas_regions_covered region_index
__________________ _________ ___________________ __________ ___________________________ _____________________ _____________________ ____________
'Amygdala_CM_' 600 -22 -2 -14 0.0079001 'Amygdala' 32 1 13
'GPe_L' 32 -28 -8 1 0.00089719 'Basal_ganglia' 100 0 28
'Caudate_Ca_R' 160 11 -2 10 0.0010236 'Basal_ganglia' 40 0 32
'Putamen_Pp_R' 160 23 -8 10 0.00092385 'Basal_ganglia' 90 0 35
'Multiple regions' 1.255e+05 26 -2 13 0.046707 'Cerebellum' 2 94 1
'Cblm_CrusI_R' 1368 50 -62 -20 0.023921 'Cerebellum' 41 0 5
'Cblm_VI_L' 192 -37 -50 -23 0.0016007 'Cerebellum' 92 0 7
'Cblm_VI_L' 64 -34 -47 -20 0.0013839 'Cerebellum' 63 0 8
'Ctx_10r_R' 96 11 52 -5 2.5951e-05 'Cortex_Default_ModeA' 25 0 21
'Ctx_RSC_R' 2016 2 -35 25 0.0086504 'Cortex_Default_ModeA' 11 0 42
'Ctx_PCV_L' 560 -4 -41 55 0.0033101 'Cortex_Default_ModeA' 59 0 59
'Ctx_STSvp_R' 160 59 -35 1 0.0027567 'Cortex_Default_ModeB' 60 0 23
'Ctx_44_L' 6376 -49 19 22 0.024559 'Cortex_Default_ModeB' 13 2 31
'Ctx_9a_L' 912 -22 49 31 0.018762 'Cortex_Default_ModeB' 39 0 47
'Ctx_8BL_R' 128 14 34 52 0.00067279 'Cortex_Default_ModeB' 81 0 65
'Ctx_PGp_R' 112 35 -83 25 0.00049686 'Cortex_Default_ModeC' 86 0 44
'Ctx_PH_L' 7944 -46 -53 -11 0.019361 'Cortex_Dorsal_AttentionA' 12 3 6
'Ctx_FST_R' 224 47 -56 -2 0.00044869 'Cortex_Dorsal_AttentionA' 25 0 22
'Ctx_TPOJ2_L' 256 -49 -56 10 0.0030985 'Cortex_Dorsal_AttentionA' 69 0 34
'Ctx_V3B_R' 384 29 -77 25 0.0031147 'Cortex_Dorsal_AttentionA' 27 1 41
'Ctx_IP1_R' 3680 35 -68 46 0.028241 'Cortex_Dorsal_AttentionA' 37 1 48
'Ctx_7PC_R' 4920 26 -41 64 0.028288 'Cortex_Dorsal_AttentionA' 15 0 63
'Ctx_7PC_R' 192 26 -59 64 0.0037989 'Cortex_Dorsal_AttentionA' 42 0 72
'Ctx_PHT_R' 616 62 -50 -2 0.016206 'Cortex_Dorsal_AttentionB' 60 0 20
'Ctx_FEF_L' 1000 -37 -2 46 0.0096505 'Cortex_Dorsal_AttentionB' 30 0 52
'Ctx_PEF_L' 160 -49 4 40 0.005486 'Cortex_Dorsal_AttentionB' 65 0 53
'Ctx_6a_L' 200 -25 -8 49 0.00097202 'Cortex_Dorsal_AttentionB' 60 0 60
'Ctx_7Am_R' 64 14 -62 64 0.00078795 'Cortex_Dorsal_AttentionB' 25 0 71
'Ctx_IFSa_L' 192 -43 31 10 0.0017536 'Cortex_Fronto_ParietalA' 13 0 36
'Ctx_IFSa_L' 144 -43 31 16 0.0031733 'Cortex_Fronto_ParietalA' 78 0 40
'Multiple regions' 13568 -25 -68 49 0.02313 'Cortex_Fronto_ParietalA' 13 6 46
'Ctx_8C_L' 8 -46 19 34 0.0031064 'Cortex_Fronto_ParietalA' 100 0 49
'Ctx_8C_L' 304 -52 16 37 0.01083 'Cortex_Fronto_ParietalA' 13 0 51
'Ctx_TE1p_R' 136 62 -44 -8 0.0052263 'Cortex_Fronto_ParietalB' 100 0 19
'Ctx_8BM_L' 152 -4 28 43 0.0016791 'Cortex_Fronto_ParietalB' 100 0 55
'Ctx_POS2_L' 80 -13 -68 43 7.0329e-06 'Cortex_Fronto_ParietalC' 30 0 56
'Ctx_7PL_R' 944 17 -74 55 0.018255 'Cortex_Fronto_ParietalC' 37 1 62
'Ctx_PeEc_R' 80 20 1 -29 0.0042842 'Cortex_Limbic' 100 0 2
'Ctx_PeEc_L' 752 -22 7 -20 0.0090266 'Cortex_Limbic' 34 0 3
'Ctx_pOFC_R' 144 20 10 -20 0.0002028 'Cortex_Limbic' 100 0 9
'Ctx_Pir_L' 72 -31 1 -17 0.00021251 'Cortex_Limbic' 33 0 14
'Ctx_6d_L' 3032 -37 -8 61 0.019067 'Cortex_SomatomotorA' 26 0 64
'Ctx_5m_R' 168 8 -38 55 0.0043739 'Cortex_SomatomotorA' 76 0 66
'Ctx_3b_L' 64 -22 -32 58 0.0015057 'Cortex_SomatomotorA' 25 0 68
'Ctx_6d_L' 224 -25 -17 58 0.0020401 'Cortex_SomatomotorA' 14 0 69
'Ctx_5L_L' 544 -19 -38 64 0.0068071 'Cortex_SomatomotorA' 25 0 70
'Ctx_3b_R' 64 23 -29 67 0.0012598 'Cortex_SomatomotorA' 38 0 73
'Ctx_4_R' 200 2 -17 67 0.0069037 'Cortex_SomatomotorA' 36 0 74
'Ctx_TPOJ1_R' 936 50 -41 1 0.0042676 'Cortex_Temporal_Parietal' 24 0 26
'Ctx_STSdp_R' 96 50 -20 1 0.00045583 'Cortex_Temporal_Parietal' 33 0 27
'Ctx_TPOJ1_R' 256 65 -38 4 0.0033548 'Cortex_Temporal_Parietal' 78 0 30
'Ctx_TPOJ1_R' 192 47 -47 13 0.0031612 'Cortex_Temporal_Parietal' 46 0 37
'Ctx_STV_L' 64 -58 -47 16 0.0018048 'Cortex_Temporal_Parietal' 25 0 39
'Multiple regions' 34936 -49 -14 13 0.027273 'Cortex_Ventral_AttentionA' 7 21 15
'Ctx_5mv_R' 616 11 -32 49 0.0036721 'Cortex_Ventral_AttentionA' 56 0 57
'Ctx_23c_R' 112 14 -32 43 0.00073374 'Cortex_Ventral_AttentionA' 57 0 58
'Ctx_SCEF_L' 1192 -10 7 61 0.012718 'Cortex_Ventral_AttentionA' 65 0 67
'Ctx_AAIC_L' 144 -28 10 -20 0.0039006 'Cortex_Ventral_AttentionB' 44 0 10
'Ctx_IFSa_R' 3320 44 49 13 0.029308 'Cortex_Ventral_AttentionB' 18 1 29
'Ctx_a9_46v_R' 208 35 46 10 0.0014815 'Cortex_Ventral_AttentionB' 23 0 33
'Ctx_9_46d_L' 1064 -31 49 25 0.02084 'Cortex_Ventral_AttentionB' 41 0 43
'Ctx_a32pr_L' 128 -16 34 25 0.00083604 'Cortex_Ventral_AttentionB' 13 0 45
'Ctx_V2_R' 11856 26 -83 -5 0.035602 'Cortex_Visual_Central' 14 3 11
'Ctx_V4_L' 176 -28 -80 -17 0.0014727 'Cortex_Visual_Central' 73 0 12
'Ctx_V4_L' 248 -28 -77 -8 0.0049448 'Cortex_Visual_Central' 100 0 16
'Ctx_V4_L' 6352 -31 -83 13 0.019195 'Cortex_Visual_Central' 17 5 24
'Ctx_V4_R' 272 29 -89 16 0.003953 'Cortex_Visual_Central' 79 0 38
'Ctx_V1_L' 8472 -10 -86 -8 0.022036 'Cortex_Visual_Peripheral' 32 0 4
'Ctx_V1_L' 192 -22 -101 -8 0.011014 'Cortex_Visual_Peripheral' 88 0 17
'Ctx_VMV3_L' 80 -31 -59 -8 0.0010789 'Cortex_Visual_Peripheral' 50 0 18
'Ctx_V1_R' 472 5 -86 4 0.014389 'Cortex_Visual_Peripheral' 92 0 25
'No label' 56 -13 1 37 0.00093978 'No description' 0 0 50
'No label' 144 -37 10 40 0.00054774 'No description' 0 0 54
'No label' 64 -22 -2 49 0.00092288 'No description' 0 0 61
Negative Effects
Region Volume XYZ maxZ modal_label_descriptions Perc_covered_by_label Atlas_regions_covered region_index
___________________ ______ _________________ ___________ ___________________________ _____________________ _____________________ ____________
'Multiple regions' 33296 47 -14 10 -0.029179 'Basal_ganglia' 7 20 76
'Multiple regions' 24576 -43 -11 7 -0.039459 'Basal_ganglia' 11 12 78
'Cau_R' 96 8 22 16 -0.0010668 'Basal_ganglia' 75 0 113
'Bstem_Ponscd' 192 -13 -20 -23 -0.0055022 'Brainstem' 50 0 82
'Bstem_Midb_R' 256 11 -17 -17 -0.0034178 'Brainstem' 81 0 85
'Bstem_Midb_R' 312 11 -17 -8 -0.011936 'Brainstem' 44 1 90
'Cblm_Dentate_L' 320 -19 -62 -32 -0.0026926 'Cerebellum' 82 0 75
'Cblm_Interposed_L' 144 -4 -56 -26 -0.0018783 'Cerebellum' 56 1 77
'Multiple regions' 18136 2 -20 1 -0.013052 'Cerebellum' 8 25 81
'Cblm_CrusI_L' 128 -10 -86 -20 -0.0035113 'Cerebellum' 94 0 83
'Ctx_10r_L' 1032 -7 43 -11 -0.020964 'Cortex_Default_ModeA' 43 1 89
'Ctx_a24_R' 336 -1 46 10 -0.0068564 'Cortex_Default_ModeA' 48 0 104
'Ctx_p24_L' 192 -4 43 19 -0.0018551 'Cortex_Default_ModeA' 79 0 114
'Ctx_RSC_R' 336 8 -38 25 -0.00311 'Cortex_Default_ModeA' 14 0 116
'Ctx_RSC_R' 536 8 -14 31 -0.0076571 'Cortex_Default_ModeA' 4 0 121
'Ctx_PGs_L' 64 -34 -74 52 -0.00057598 'Cortex_Default_ModeA' 75 0 127
'Ctx_45_L' 104 -61 22 7 -0.010664 'Cortex_Default_ModeB' 38 0 103
'Ctx_9a_L' 1312 -25 43 31 -0.015036 'Cortex_Default_ModeB' 31 0 118
'Ctx_SFL_L' 120 -4 25 61 -0.00028241 'Cortex_Default_ModeB' 100 0 137
'Ctx_RSC_L' 128 -4 -20 31 -0.0050858 'Cortex_Default_ModeC' 50 0 124
'Multiple regions' 32040 32 -74 19 -0.041628 'Cortex_Dorsal_AttentionA' 7 21 79
'Ctx_IP0_L' 440 -34 -68 28 -0.0081333 'Cortex_Dorsal_AttentionA' 36 0 120
'Multiple regions' 13984 -25 -65 52 -0.031143 'Cortex_Dorsal_AttentionA' 9 8 123
'Ctx_PHT_R' 192 53 -56 -20 -0.015151 'Cortex_Dorsal_AttentionB' 63 0 84
'Ctx_PFop_L' 8 -58 -26 22 -0.0012731 'Cortex_Dorsal_AttentionB' 100 0 117
'Ctx_2_R' 2944 23 -32 61 -0.012531 'Cortex_Dorsal_AttentionB' 24 0 130
'Ctx_2_L' 3064 -22 -35 61 -0.010423 'Cortex_Dorsal_AttentionB' 22 0 131
'Ctx_5L_R' 320 8 -44 64 -0.01078 'Cortex_Dorsal_AttentionB' 30 0 138
'Multiple regions' 18456 -43 16 28 -0.029079 'Cortex_Fronto_ParietalA' 10 8 97
'Multiple regions' 35704 2 13 25 -0.023757 'Cortex_Fronto_ParietalB' 4 20 92
'Ctx_a47r_R' 1360 44 49 -5 -0.026668 'Cortex_Fronto_ParietalB' 39 0 94
'Ctx_TE1p_R' 3440 59 -44 1 -0.012307 'Cortex_Fronto_ParietalB' 21 0 95
'Ctx_PFm_R' 256 53 -38 40 -0.0053111 'Cortex_Fronto_ParietalB' 69 0 126
'Ctx_7PL_R' 448 8 -74 58 -0.014047 'Cortex_Fronto_ParietalC' 61 0 128
'Ctx_5m_L' 600 -10 -44 58 -0.002688 'Cortex_SomatomotorA' 55 0 129
'Ctx_5m_R' 136 8 -38 61 -0.0050374 'Cortex_SomatomotorA' 59 0 134
'Ctx_4_L' 192 -40 -17 61 -0.0024378 'Cortex_SomatomotorA' 25 0 135
'Ctx_4_R' 816 -1 -14 67 -0.018976 'Cortex_SomatomotorA' 33 0 139
'Ctx_TA2_R' 560 47 4 -11 -0.0091674 'Cortex_SomatomotorB' 46 0 88
'Ctx_A4_R' 48 62 -17 10 -0.0076583 'Cortex_SomatomotorB' 50 0 106
'Ctx_A4_L' 240 -67 -29 16 -0.012324 'Cortex_SomatomotorB' 67 0 107
'Ctx_A4_R' 64 68 -17 13 -0.0028484 'Cortex_SomatomotorB' 25 0 108
'Ctx_OP4_R' 8 53 -17 13 -0.00095263 'Cortex_SomatomotorB' 100 0 109
'Ctx_OP2_3_R' 16 32 -20 16 -3.9951e-05 'Cortex_SomatomotorB' 100 0 112
'Ctx_A5_R' 2176 53 -20 1 -0.0124 'Cortex_Temporal_Parietal' 40 1 96
'Ctx_PSL_R' 64 62 -35 16 -0.00056532 'Cortex_Temporal_Parietal' 50 0 111
'Ctx_PoI1_L' 184 -43 -5 -14 -0.021258 'Cortex_Ventral_AttentionA' 43 0 87
'Ctx_PI_R' 96 44 -8 -11 -0.010767 'Cortex_Ventral_AttentionA' 67 0 91
'Ctx_PoI2_R' 8 41 -2 4 -0.0008819 'Cortex_Ventral_AttentionA' 100 0 101
'Ctx_PF_L' 184 -52 -41 28 -0.0016471 'Cortex_Ventral_AttentionA' 100 0 122
'Ctx_SCEF_L' 192 -13 4 55 -0.0057718 'Cortex_Ventral_AttentionA' 63 0 132
'Ctx_5mv_R' 232 14 -35 58 -0.007653 'Cortex_Ventral_AttentionA' 21 0 133
'Ctx_SCEF_R' 120 5 13 61 -0.0014173 'Cortex_Ventral_AttentionA' 60 0 136
'Ctx_a9_46v_R' 2016 41 46 10 -0.015285 'Cortex_Ventral_AttentionB' 56 1 102
'Ctx_p24_R' 136 -4 37 13 -0.0030707 'Cortex_Ventral_AttentionB' 65 0 110
'Ctx_a9_46v_R' 488 41 52 22 -0.009891 'Cortex_Ventral_AttentionB' 43 0 115
'Ctx_9_46d_L' 136 -31 46 22 -0.0014032 'Cortex_Ventral_AttentionB' 100 0 119
'Multiple regions' 33760 -40 -65 -5 -0.037838 'Cortex_Visual_Central' 6 15 80
'Ctx_V3_R' 344 20 -77 -11 -0.0060614 'Cortex_Visual_Central' 63 0 86
'Ctx_V2_R' 128 11 -86 -8 -0.00095027 'Cortex_Visual_Central' 81 0 93
'Ctx_LO3_L' 144 -40 -77 10 -0.0018604 'Cortex_Visual_Central' 56 0 105
'Ctx_V1_L' 992 -4 -80 4 -0.0095848 'Cortex_Visual_Peripheral' 77 0 98
'Ctx_V1_L' 1344 -10 -62 4 -0.0077122 'Cortex_Visual_Peripheral' 59 0 99
'No label' 208 -43 -53 1 -0.0012288 'No description' 0 0 100
'No label' 64 -7 -11 31 -0.0004923 'No description' 0 0 125
____________________________________________________________________________________________________________________________________________
Regions labeled by reference atlas CANlab_2018_combined
Volume: Volume of contiguous region in cubic mm.
MaxZ: Signed max over Input mask image values for each voxel.
Atlas_regions_covered: Number of reference atlas regions covered at least 25% by the region. This relates to whether the region covers
multiple reference atlas regions
Region: Best reference atlas label, defined as reference region with highest number of in-region voxels. Regions covering >25% of >5
regions labeled as "Multiple regions"
Perc_covered_by_label: Percentage of the region covered by the label.
Ref_region_perc: Percentage of the label region within the target region.
modal_atlas_index: Index number of label region in reference atlas
all_regions_covered: All regions covered >5% in descending order of importance
For example, if a region is labeled 'TE1a' and Perc_covered_by_label = 8, Ref_region_perc = 38, and Atlas_regions_covered = 17, this means
that 8% of the region's voxels are labeled TE1a, which is the highest percentage among reference label regions. 38% of the region TE1a is
covered by the region. However, the region covers at least 25% of 17 distinct labeled reference regions.
References for atlases:
Beliveau, Vincent, Claus Svarer, Vibe G. Frokjaer, Gitte M. Knudsen, Douglas N. Greve, and Patrick M. Fisher. 2015. “Functional
Connectivity of the Dorsal and Median Raphe Nuclei at Rest.” NeuroImage 116 (August): 187–95.
Bär, Karl-Jürgen, Feliberto de la Cruz, Andy Schumann, Stefanie Koehler, Heinrich Sauer, Hugo Critchley, and Gerd Wagner. 2016. ?Functional
Connectivity and Network Analysis of Midbrain and Brainstem Nuclei.? NeuroImage 134 (July):53?63.
Diedrichsen, Jörn, Joshua H. Balsters, Jonathan Flavell, Emma Cussans, and Narender Ramnani. 2009. A Probabilistic MR Atlas of the Human
Cerebellum. NeuroImage 46 (1): 39?46.
Fairhurst, Merle, Katja Wiech, Paul Dunckley, and Irene Tracey. 2007. ?Anticipatory Brainstem Activity Predicts Neural Processing of Pain
in Humans.? Pain 128 (1-2):101?10.
Fan 2016 Cerebral Cortex; doi:10.1093/cercor/bhw157
Glasser, Matthew F., Timothy S. Coalson, Emma C. Robinson, Carl D. Hacker, John Harwell, Essa Yacoub, Kamil Ugurbil, et al. 2016. A
Multi-Modal Parcellation of Human Cerebral Cortex. Nature 536 (7615): 171?78.
Keren, Noam I., Carl T. Lozar, Kelly C. Harris, Paul S. Morgan, and Mark A. Eckert. 2009. “In Vivo Mapping of the Human Locus Coeruleus.”
NeuroImage 47 (4): 1261–67.
Keuken, M. C., P-L Bazin, L. Crown, J. Hootsmans, A. Laufer, C. Müller-Axt, R. Sier, et al. 2014. “Quantifying Inter-Individual Anatomical
Variability in the Subcortex Using 7 T Structural MRI.” NeuroImage 94 (July): 40–46.
Krauth A, Blanc R, Poveda A, Jeanmonod D, Morel A, Székely G. (2010) A mean three-dimensional atlas of the human thalamus: generation from
multiple histological data. Neuroimage. 2010 Feb 1;49(3):2053-62. Jakab A, Blanc R, Berényi EL, Székely G. (2012) Generation of
Individualized Thalamus Target Maps by Using Statistical Shape Models and Thalamocortical Tractography. AJNR Am J Neuroradiol. 33:
2110-2116, doi: 10.3174/ajnr.A3140
Nash, Paul G., Vaughan G. Macefield, Iven J. Klineberg, Greg M. Murray, and Luke A. Henderson. 2009. ?Differential Activation of the Human
Trigeminal Nuclear Complex by Noxious and Non-Noxious Orofacial Stimulation.? Human Brain Mapping 30 (11):3772?82.
Pauli 2018 Bioarxiv: CIT168 from Human Connectome Project data
Pauli, Wolfgang M., Amanda N. Nili, and J. Michael Tyszka. 2018. ?A High-Resolution Probabilistic in Vivo Atlas of Human Subcortical Brain
Nuclei.? Scientific Data 5 (April): 180063.
Pauli, Wolfgang M., Randall C. O?Reilly, Tal Yarkoni, and Tor D. Wager. 2016. ?Regional Specialization within the Human Striatum for
Diverse Psychological Functions.? Proceedings of the National Academy of Sciences of the United States of America 113 (7): 1907?12.
Sclocco, Roberta, Florian Beissner, Gaelle Desbordes, Jonathan R. Polimeni, Lawrence L. Wald, Norman W. Kettner, Jieun Kim, et al. 2016.
?Neuroimaging Brainstem Circuitry Supporting Cardiovagal Response to Pain: A Combined Heart Rate Variability/ultrahigh-Field (7 T)
Functional Magnetic Resonance Imaging Study.? Philosophical Transactions. Series A, Mathematical, Physical, and Engineering Sciences 374
(2067). rsta.royalsocietypublishing.org. https://doi.org/10.1098/rsta.2015.0189.
Shen, X., F. Tokoglu, X. Papademetris, and R. T. Constable. 2013. “Groupwise Whole-Brain Parcellation from Resting-State fMRI Data for
Network Node Identification.” NeuroImage 82 (November): 403–15.
Zambreanu, L., R. G. Wise, J. C. W. Brooks, G. D. Iannetti, and I. Tracey. 2005. ?A Role for the Brainstem in Central Sensitisation in
Humans. Evidence from Functional Magnetic Resonance Imaging.? Pain 114 (3):397?407.
Note: Region object r(i).title contains full list of reference atlas regions covered by each cluster.
____________________________________________________________________________________________________________________________________________