Constructing a Second-Level fMRI Analysis Pipeline
This page contains a walk-through for creating a second-level analysis including code, results, and figures
CAN Lab Second-Level Analysis Scripts: What They are and What They Do
This is a set of scripts that is designed to facilitate second-level analysis across beta (COPE), or contrast images from a group of participants. The idea is to have a standardized set of scripts that extract and process data in the same way across studies, which (a) increases readability and understanding of the data structure, (b) decreases the need to re-write custom code to perform the same analyses over and over, and (c) facilitates analysis of defined measures across studies. The CANlab scripts are also designed to be easily customizable, so you can add study-specific analyses to your workflow by adding short, modular scripts with few lines of code.
The workflow does several things, saving data and output in standardized formats, and creating time-stamped HTML reports with plots, tables, images, and stats in one document so you have an archival record of the whole analysis. This also facilitates writing papers and sharing data and results with others. The two main stages are:
Data Preparation:
- Load data from image files and meta-data spreadsheet(s), create and save data structures
- Image data outlier analysis and scaling (use is optional in analyses)
- Extraction of global gray, white, and CSF components (assumes MNI space)
- Image data quality control metrics; HTML report
- Extract pre-defined “signatures”, data from standard pre-defined networks and brain parcels
- Bootstrapping of support vector machine analyses for contrasts (optional)
- Save all results in standardized data structures
Analysis Workflows:
- Load saved data structures, run sequences of short, customizable modular scripts
- “Coverage and contrasts”: Voxel-wise brain maps for all contrasts, whole-brain support vector machine classifiers
- “Signature analyses”: Expression of CANlab pre-defined signatures, e.g., NPS (requires private repository with signatures)
- Create your own: Network polar plots, meta-analysis masks, parcels, etc.
(1.) Install the CANlab_help_examples folder from Github.
This Youtube video can help:
(2.) Add all the folders to PATH
In MATLAB genpath(addpath(‘/CANLab_help_examples/’)) genpath(addpath(‘/YOUR_ANALYSIS_FOLDER/’))
Check and make sure you have all the paths and dependencies before you get started by running this script (found in CANLab_help_examples): run(‘/CANlab_help_examples/Second_level_analysis_template_scripts/a2_second_level_toolbox_check_dependencies.m’)
(3.) Set up Your Data Analysis Folder
Are your data set up so that the folders represent conditions and inside those folders are subject data? If not, maybe this bash reorganization script will help you. Alternatively you can change the way the 2nd Level Scripts look at your folders. However, I recommend you keep their inherent structure the same and just conform. Path of least resistance. Do not apply this advice to your social life.
Set Up New Folders:
There is a script you can use which will auto set up your folders to play well with the 2nd level analysis pipeline. Go to your new Analysis folder and run this from within it: a_set_up_new_analysis_folder_and_script.m
If you want to do this by hand you can go to your Analysis folder set up these subfolders:
- data
- extras
- results
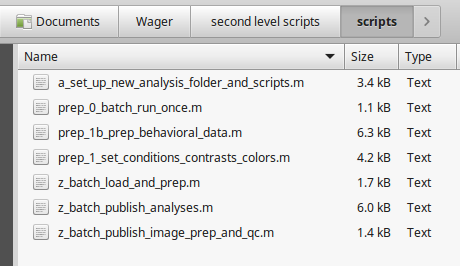
- scripts
- Copy in a series of scripts from CANLab_help_examples as shown here:
Set Up the Study Info Document:
Copy over to your Analysis folder ‘study_info.json’
(4.) Modify the Template Scripts
- In a text editor, edit the study_info.json file to fit your data
For example:
{
"Primary_publication":
"Fill in this JSON-format file and call it study_info.json, in your main
study folder. This field would contain the primary publication associated
with the study, if any, or null if none.",

"Associated_publications":
"Other publications here. e.g.,
Sylvester, C. Y., Wager, T. D., Lacey, S. C., Hernandez, L.,
Nochols, T. E., Smith E. E., Jonides, J.. (2003). Switching attention and resolving
interference: fMRI measures of executive functions. Neuropsychologia, 41, 357-70.",

"Notes":
"This dataset was shared by Guido Frank's lab for the purpose of collaborative
SVM analyses and consulting on eating disorders.",

"Publication_URLs":
"http://www.sciencedirect.com/science/article/pii/S1053811905000418
http://www.sciencedirect.com/science/article/pii/S0028393202001677",

"Publication_DOIs": null,

"Paradigm_files_links": null,

"Data_files_links": null,

"IRB_number": null,

"Scanner_site": "University of Michigan",

"Field_strength": "3.0T",

"Citing_this_work":
"If you use this dataset in a publication,
please include as authors or acknowledge individuals as specified below.
Please also see information on publications and grants to cite.",

"Authors_to_include_on_reuse": null,

"Authors_to_acknowledge_on_reuse": "Tor Wager, John Jonides",

"Grant_numbers_to_cite": null


}