Object-oriented analysis
The CANlab tools enable interactive analysis of fMRI and other neuroimaging data through a small set of objects with simple, high-level methods (commands) tailored to neuroimaging. The toolboxes are distributed across linked GitHub repositories.
Philosophy and principles
Much of neuroimaging analysis, like other areas of science, has moved toward pipelines: standardized processing streams that produce reliable results with optimized procedures. This is an essential part of any technology. At the same time, there is a need for creativity and exploration in order to discover new ways of doing things, and a need to understand data — its characteristics, its quirks and outliers, and its behavior under different conditions — in order to avoid spurious results and understand what is true. Exploration and discovery require the ability to visualize data in a variety of ways, interact with it, and create analyses that fit the questions at hand.
There are many established pipelines for neuroimaging, but relatively few tools that provide flexibility and the ability to interact with data. The CANlab toolboxes were designed with interactive analysis in mind. The idea is to take preprocessed data — or even the results of single-subject analyses — and import them into lightweight, flexible data objects specialized for neuroimaging. These objects allow interactive analysis with simple commands like plot, predict, and montage.
The code is necessarily a work in progress, but here are the values we aspire to:
- Interactivity. Complex operations reduce to simple commands. Single commands perform stratified, cross-validated multivariate prediction, or render results on brain slices or surfaces. Analysts can explore the distribution of data and the consequences of altering analysis choices as they go.
- Transparency. Scripts built from these commands are easy to read, write, and interpret, which increases transparency and reduces coding errors. Organizing the toolbox around a few core objects makes it easier to discover what they can do (their methods).
- Reproducibility. Simple, transparent commands make it easy to share the code needed to reproduce an analysis in a format others can understand and use.
- Minimization of errors. Core object functions are re-used and vetted across analyses and users. The walkthroughs — and a growing suite of unit tests that run on every push and nightly — check that core functions run and produce expected results across platforms and software versions.
- Efficiency. A batch system built on simple object commands runs standard quality-control checks and analyses and saves date-stamped HTML reports with figures and statistics. Standardized variable names make folder and file structure easy to understand, which promotes meaningful sharing and archiving, and speeds up writing papers.
- Shareability. The data objects are space-efficient, storing imaging data in a fraction of the disk space of full images.
- Extensibility. The object-oriented framework lets developers and data scientists add new methods or object types. New analytic techniques plug in easily: objects store images in a flat 2-D matrix (voxels × images) familiar to data scientists from all fields, and core object code handles rendering results back into brain space, including visualization and anatomical labeling. This makes neuroimaging accessible to data scientists developing sophisticated new analyses.
For a complete set of object references, workflows, and visualization guides, see the Docs page.
Where to find walkthroughs and batch scripts
- Walkthroughs: the walkthroughs index is the main entry point. Source
.mfiles are in the CANlab_help_examples repository underexample_help_files; the rendered HTML reports are underpublished_html. - Batch scripts: the second-level analysis batch system lives in the same repository under
Second_level_analysis_template_scripts. See the batch system page for an overview.
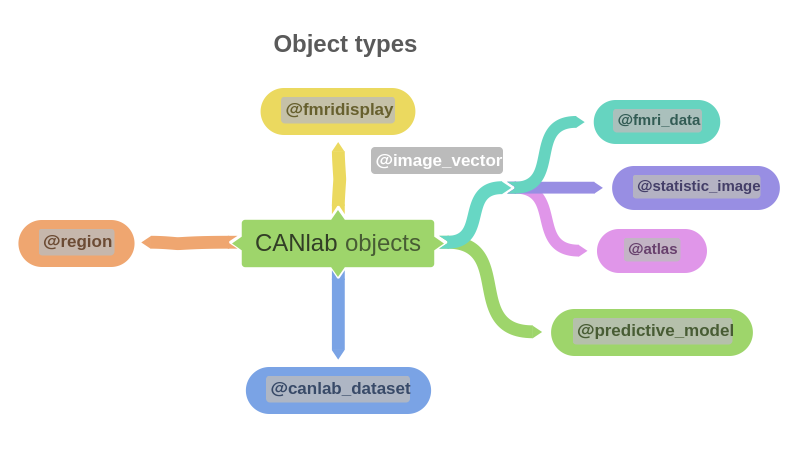
Types of objects
Click a class name for its full documentation (properties, methods grouped by category, and examples). The Object methods index lists the complete set.
| Object | Description |
|---|---|
fmri_data | The workhorse. Holds fMRI / PET images plus metadata; most analysis methods (predict, regress, ica, searchlight, ttest, signtest) live here |
image_vector | Abstract superclass; source of shared methods (apply_mask, resample_space, montage, surface, extract_roi_averages) |
statistic_image | Statistic maps (t / p / effect size) with thresholding state; threshold re-thresholds without losing values |
atlas | Brain atlases / parcellations with labels and probability maps; select_atlas_subset, merge_atlases, load_atlas |
fmri_surface_data | New. Cortical-surface / grayordinate (CIFTI) data — native CIFTI/GIFTI, vol2surf / surf2vol, familiar methods |
region | Contiguous clusters / ROIs as a unit of analysis; produced by region(t), consumed by montage, table, surface |
fmridisplay | Container for slice/surface figure handles; swap blob layers without re-rendering the anatomy |
glm_map | New. scikit-learn-style estimator for first- and second-level GLM / regression, with design diagnostics |
predictive_model | New. A fitted multivariate prediction model and its artifacts (weights, CV predictions, performance) |
canlab_dataset | Subject × variable behavioral / clinical data with glm, mediation, scatterplot methods |
brainpathway | Connectivity / pathway-modeling object (single- and multi-subject) |
fmri_data object: features and philosophy
- Flat format. Image data lives in a 2-D voxels × images matrix that’s space-efficient and easy to feed into any other analysis package.
- Compact storage. Out-of-image and empty voxels are removed, and data are kept in single precision.
- Reversible. Metadata is retained so you can reconstruct the 3-D image volume at any time. Built-in resampling makes it easy to combine datasets with different voxel sizes and bounding boxes.
- Multi-image. A single object can hold many images.
- Short, intuitive method names specialized for neuroimaging:
- Visualization —
plot,orthviews,surface,montage,histogram,isosurface - Image manipulation —
apply_mask,get_wh_image,resample_space,compare_space,flip,threshold - Data extraction —
apply_atlas,apply_parcellation,extract_gray_white_csf,extract_roi_averages - Analysis —
ica,mahal,image_math, and many more in thefmri_datasubclass
- Visualization —
- Provenance. History of changes to an object is tracked and updated.
- Documentation. In Matlab,
doc <class_name>(e.g.doc fmri_data) shows properties, methods, and examples.
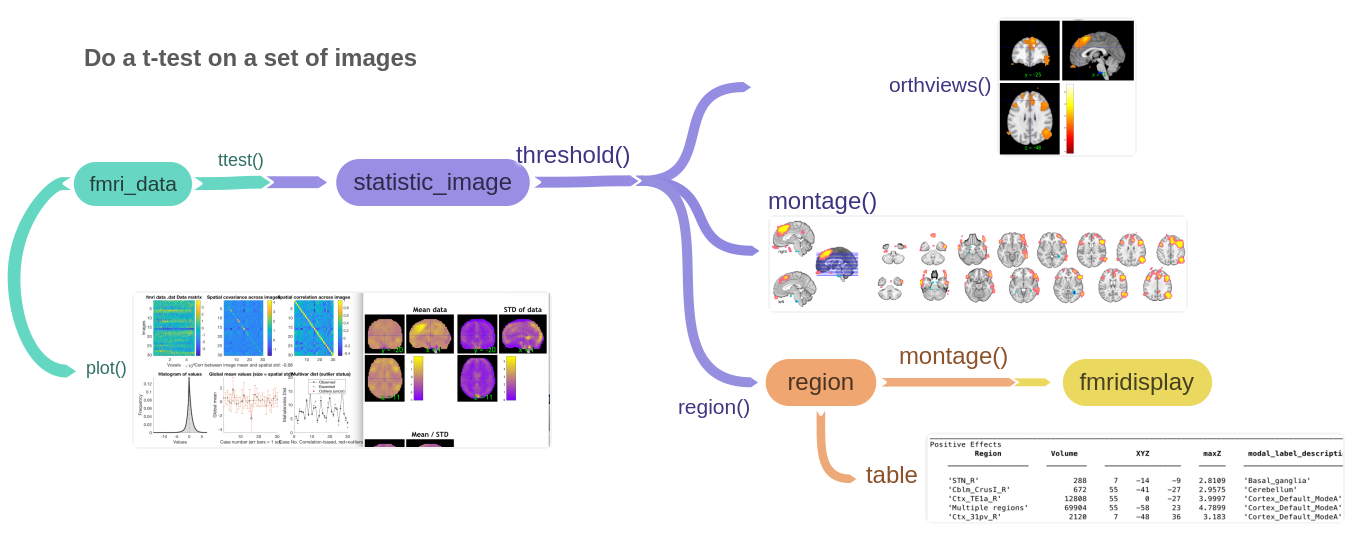
A simple analysis flow
The diagram below shows a flowchart for a simple group analysis: load a set of images (.nii or .img, one per subject) into an fmri_data object, then a few commands perform a t-test (or other analysis), threshold the resulting statistic map (a statistic_image object), and display interactive views, slice montages, region tables with automatic anatomical labels, and more.